

Actual patterns

Patterns are graphical models which are formed in the chart by the price. According to one of the technical analysis postulates, history (price movement) repeats itself. It means that the price movements are often similar in the same situations which makes it possible to predict the further development of the situation with a high probability.
Relevant patterns by InstaTrade is an easy-to-use service which allows you to be aware of latest changes in the market and react to clues from the market in time. In our service you will always find the latest and most relevant patterns on any pair and any timeframe.
Double Bottom
was formed on 26.03 at 02:30:14 (UTC+0)
signal strength 3 of 5
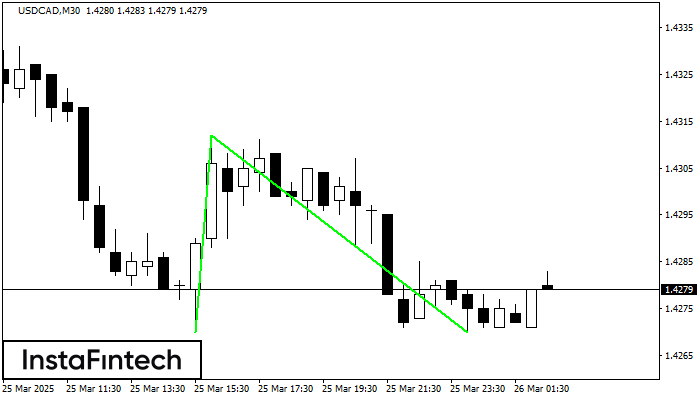
The Double Bottom pattern has been formed on USDCAD M30. Characteristics: the support level 1.4270; the resistance level 1.4312; the width of the pattern 42 points. If the resistance level is broken, a change in the trend can be predicted with the first target point lying at the distance of 42 points.
- All
- All
- Bearish Rectangle
- Bearish Symmetrical Triangle
- Bearish Symmetrical Triangle
- Bullish Rectangle
- Double Top
- Double Top
- Triple Bottom
- Triple Bottom
- Triple Top
- Triple Top
- All
- All
- Buy
- Sale
- All
- 1
- 2
- 3
- 4
- 5
Двойное дно
сформирован 22.05 в 18:15:26 (UTC+0)
сила сигнала 1 из 5
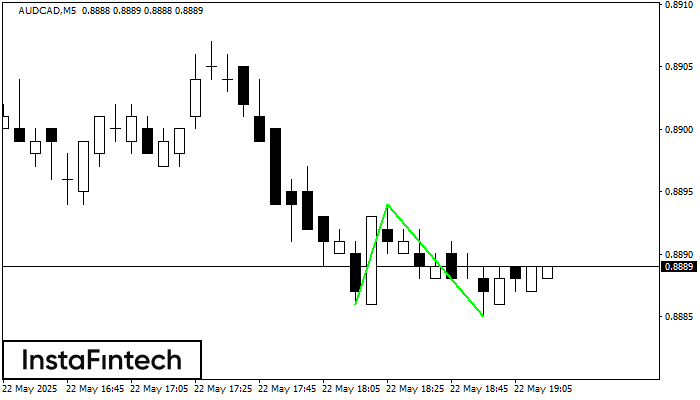
Сформирована фигура «Двойное дно» на графике AUDCAD M5. Верхняя граница 0.8894; Нижняя граница 0.8885; Ширина фигуры 8 пунктов. В случае пробоя верхней границы 0.8894 можно будет прогнозировать изменение тенденции
Таймфреймы М5 и М15 могут иметь больше ложных точек входа.
Открыть график инструмента в новом окне
Двойное дно
сформирован 22.05 в 17:45:33 (UTC+0)
сила сигнала 2 из 5
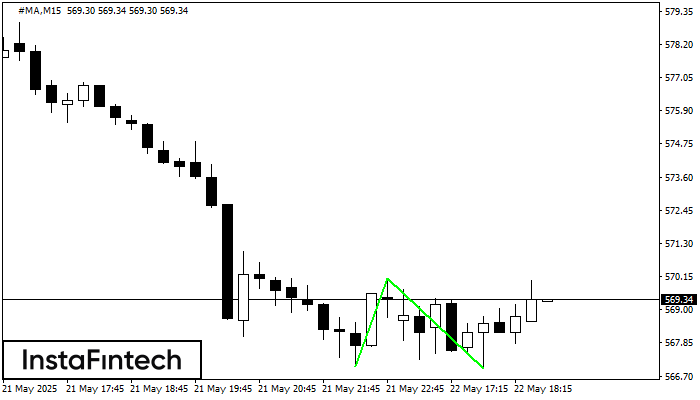
Сформирована фигура «Двойное дно» на графике #MA M15. Данное формирование сигнализирует об изменении тенденции с нисходящего на восходящее движение. Сигнал: Торговую позицию на покупку следует открывать после пробоя верхней границы
Таймфреймы М5 и М15 могут иметь больше ложных точек входа.
Открыть график инструмента в новом окне
Двойная вершина
сформирован 22.05 в 17:30:27 (UTC+0)
сила сигнала 1 из 5
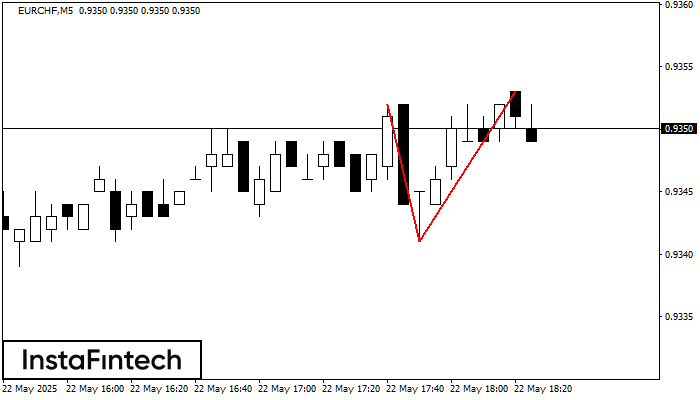
По EURCHF на M5 сформировалась разворотная фигура «Двойная вершина». Характеристика: Верхняя граница 0.9352; Нижняя граница 0.9341; Ширина фигуры 12 пунктов. Позицию на продажу возможно открыть ниже нижней границы 0.9341
Таймфреймы М5 и М15 могут иметь больше ложных точек входа.
Открыть график инструмента в новом окне


