

Actual patterns

Patterns are graphical models which are formed in the chart by the price. According to one of the technical analysis postulates, history (price movement) repeats itself. It means that the price movements are often similar in the same situations which makes it possible to predict the further development of the situation with a high probability.
Relevant patterns by InstaTrade is an easy-to-use service which allows you to be aware of latest changes in the market and react to clues from the market in time. In our service you will always find the latest and most relevant patterns on any pair and any timeframe.
Actual Patterns
- All
- All
- Bearish Rectangle
- Bearish Symmetrical Triangle
- Bearish Symmetrical Triangle
- Bullish Rectangle
- Double Top
- Double Top
- Triple Bottom
- Triple Bottom
- Triple Top
- Triple Top
- All
- All
- Buy
- Sale
- All
- 1
- 2
- 3
- 4
- 5
Double Bottom
was formed on 21.05 at 09:15:21 (UTC+0)
signal strength 2 of 5
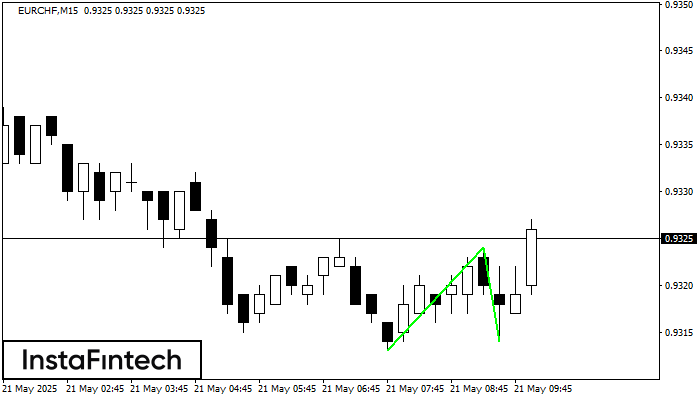
The Double Bottom pattern has been formed on EURCHF M15. Characteristics: the support level 0.9313; the resistance level 0.9324; the width of the pattern 11 points. If the resistance level
The M5 and M15 time frames may have more false entry points.
Open chart in a new window
Bullish pennant
was formed on 21.05 at 08:54:57 (UTC+0)
signal strength 1 of 5
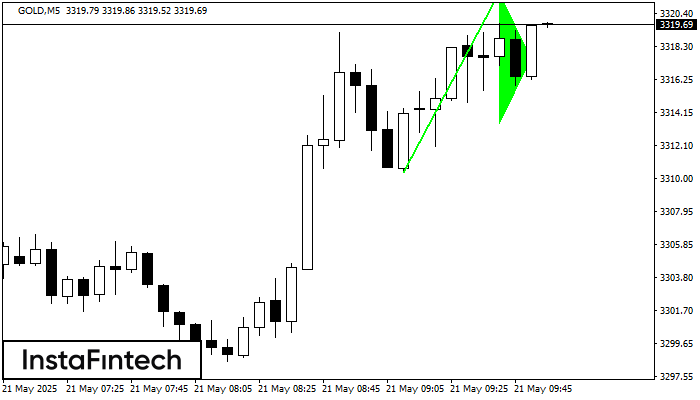
The Bullish pennant graphic pattern has formed on the GOLD M5 instrument. This pattern type falls under the category of continuation patterns. In this case, if the quote can breaks
The M5 and M15 time frames may have more false entry points.
Open chart in a new window
Triple Top
was formed on 21.05 at 07:45:02 (UTC+0)
signal strength 1 of 5
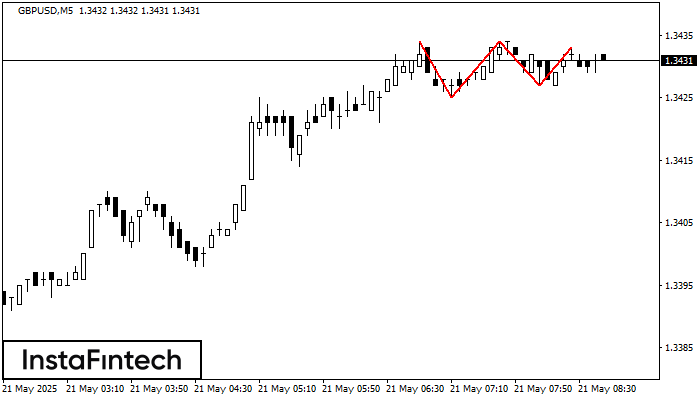
The Triple Top pattern has formed on the chart of the GBPUSD M5 trading instrument. It is a reversal pattern featuring the following characteristics: resistance level 1, support level -2
The M5 and M15 time frames may have more false entry points.
Open chart in a new window
Double Bottom
was formed on 21.05 at 07:40:11 (UTC+0)
signal strength 1 of 5
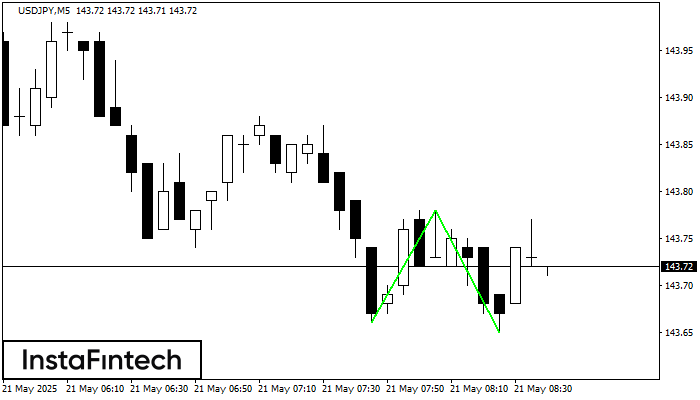
The Double Bottom pattern has been formed on USDJPY M5; the upper boundary is 143.78; the lower boundary is 143.65. The width of the pattern is 12 points. In case
The M5 and M15 time frames may have more false entry points.
Open chart in a new window
Double Bottom
was formed on 21.05 at 06:56:25 (UTC+0)
signal strength 1 of 5
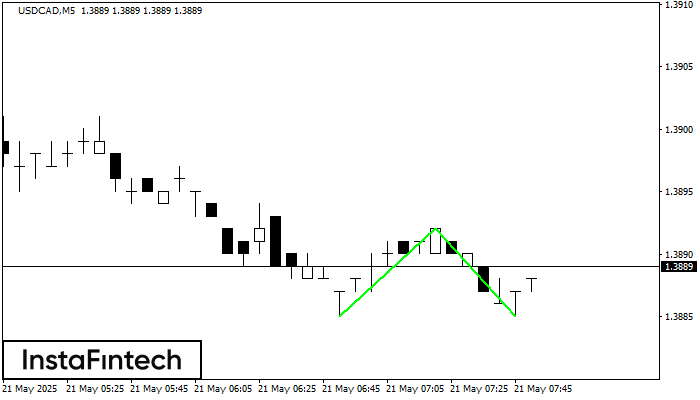
The Double Bottom pattern has been formed on USDCAD M5; the upper boundary is 1.3892; the lower boundary is 1.3885. The width of the pattern is 7 points. In case
The M5 and M15 time frames may have more false entry points.
Open chart in a new window
Double Bottom
was formed on 21.05 at 06:45:15 (UTC+0)
signal strength 2 of 5
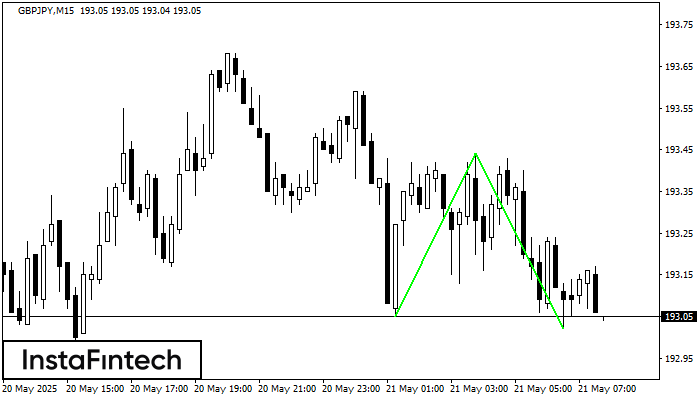
The Double Bottom pattern has been formed on GBPJPY M15; the upper boundary is 193.44; the lower boundary is 193.02. The width of the pattern is 39 points. In case
The M5 and M15 time frames may have more false entry points.
Open chart in a new window
Bearish Symmetrical Triangle
was formed on 21.05 at 06:17:36 (UTC+0)
signal strength 3 of 5
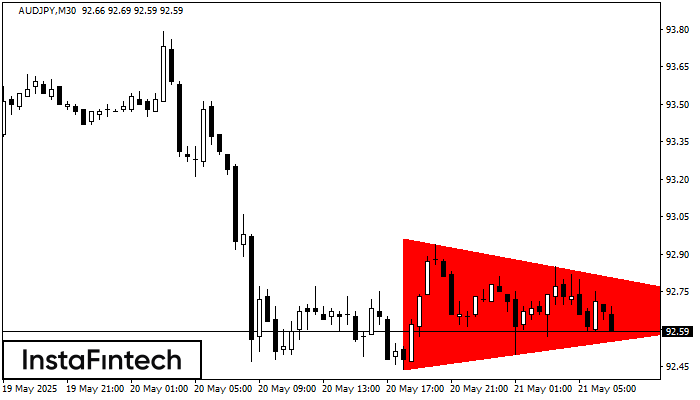
According to the chart of M30, AUDJPY formed the Bearish Symmetrical Triangle pattern. Description: The lower border is 92.44/92.66 and upper border is 92.96/92.66. The pattern width is measured
Open chart in a new window
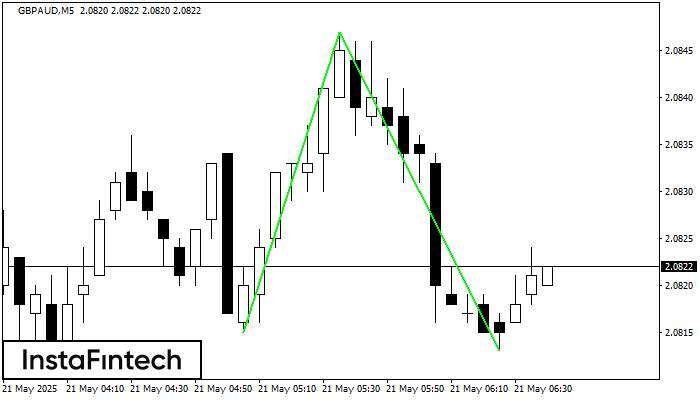
Double Bottom
was formed on 21.05 at 06:05:21 (UTC+0)
signal strength 1 of 5
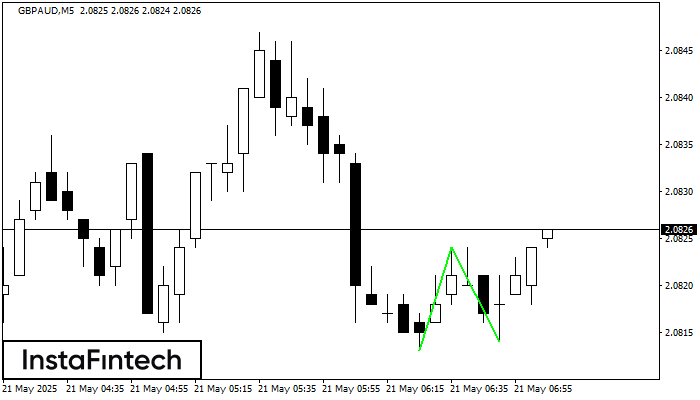
The Double Bottom pattern has been formed on GBPAUD M5; the upper boundary is 2.0824; the lower boundary is 2.0814. The width of the pattern is 11 points. In case
The M5 and M15 time frames may have more false entry points.
Open chart in a new window
Double Bottom
was formed on 21.05 at 05:40:20 (UTC+0)
signal strength 1 of 5
The Double Bottom pattern has been formed on GBPAUD M5; the upper boundary is 2.0847; the lower boundary is 2.0813. The width of the pattern is 32 points. In case
The M5 and M15 time frames may have more false entry points.
Open chart in a new window


