

Padrões atuais

Padrões são modelos gráficos que são formados no gráfico pelo preço. Segundo um dos postulados da análise técnica, a história (movimento de preços) se repete. Isso significa que os movimentos de preços geralmente são semelhantes nas mesmas situações, o que possibilita prever o desenvolvimento futuro da situação com alta probabilidade.
Os padrões relevantes da InstaTrade são um serviço fácil de usar, que permite que você esteja ciente das últimas mudanças no mercado e reaja a indícios do mercado a tempo. Em nosso serviço, você sempre encontrará os padrões mais recentes e relevantes em qualquer par e em qualquer período gráfico.
Double Bottom
was formed on 29.04 at 13:45:23 (UTC+0)
signal strength 1 of 5
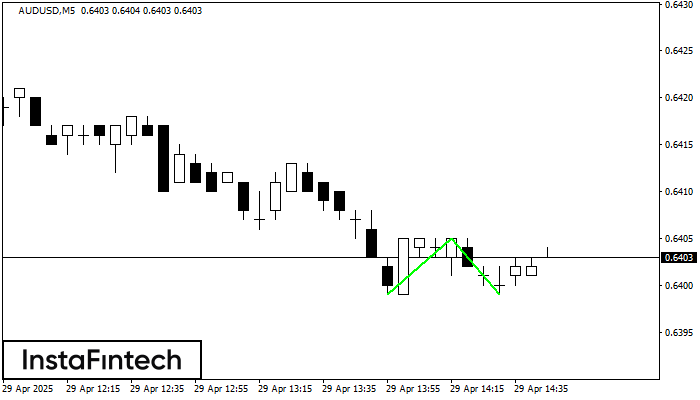
The Double Bottom pattern has been formed on AUDUSD M5. Characteristics: the support level 0.6399; the resistance level 0.6405; the width of the pattern 6 points. If the resistance level is broken, a change in the trend can be predicted with the first target point lying at the distance of 6 points.
The M5 and M15 time frames may have more false entry points.
Veja também
- All
- All
- Bearish Rectangle
- Bearish Symmetrical Triangle
- Bearish Symmetrical Triangle
- Bullish Rectangle
- Double Top
- Double Top
- Triple Bottom
- Triple Bottom
- Triple Top
- Triple Top
- All
- All
- Buy
- Sale
- All
- 1
- 2
- 3
- 4
- 5
Fundo duplo
was formed on 21.05 at 06:56:25 (UTC+0)
signal strength 1 of 5
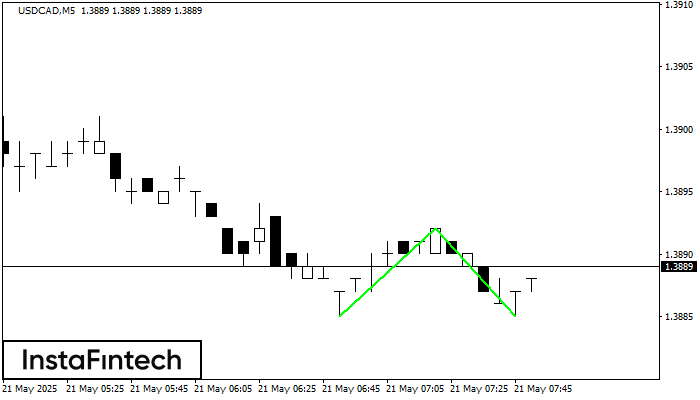
O padrão Fundo duplo foi formado em USDCAD M5; o limite superior é 1.3892; o limite inferior é 1.3885. A largura do padrão é de 7 pontos. No caso
Os intervalos M5 e M15 podem ter mais pontos de entrada falsos.
Open chart in a new window
Fundo duplo
was formed on 21.05 at 06:45:15 (UTC+0)
signal strength 2 of 5
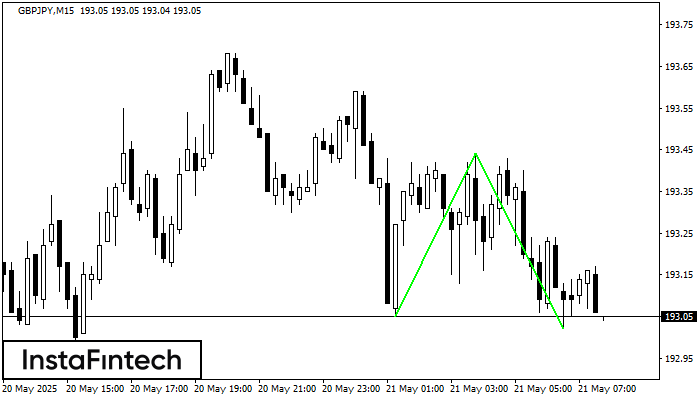
O padrão Fundo duplo foi formado em GBPJPY M15; o limite superior é 193.44; o limite inferior é 193.02. A largura do padrão é de 39 pontos. No caso
Os intervalos M5 e M15 podem ter mais pontos de entrada falsos.
Open chart in a new window
Triângulo Simétrico de Baixa
was formed on 21.05 at 06:17:36 (UTC+0)
signal strength 3 of 5
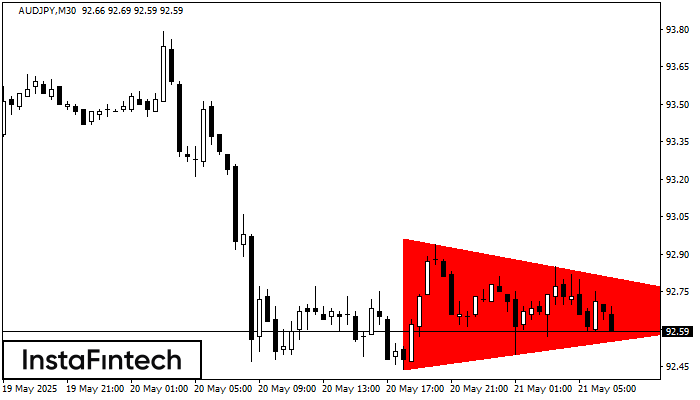
De acordo com o gráfico de M30, AUDJPY formou o padrão Triângulo Simétrico de Baixa. Descrição: o limite inferior é 92.44/92.66 e o limite superior é 92.96/92.66. A largura
Open chart in a new window


