

Padrões atuais

Padrões são modelos gráficos que são formados no gráfico pelo preço. Segundo um dos postulados da análise técnica, a história (movimento de preços) se repete. Isso significa que os movimentos de preços geralmente são semelhantes nas mesmas situações, o que possibilita prever o desenvolvimento futuro da situação com alta probabilidade.
Os padrões relevantes da InstaTrade são um serviço fácil de usar, que permite que você esteja ciente das últimas mudanças no mercado e reaja a indícios do mercado a tempo. Em nosso serviço, você sempre encontrará os padrões mais recentes e relevantes em qualquer par e em qualquer período gráfico.
Triple Top
was formed on 29.04 at 13:39:45 (UTC+0)
signal strength 1 of 5
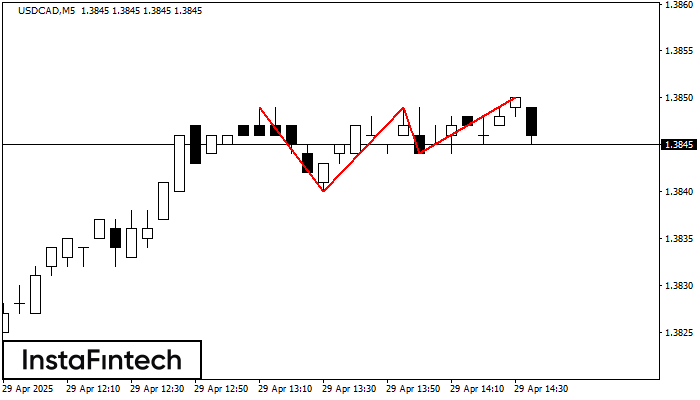
The Triple Top pattern has formed on the chart of the USDCAD M5 trading instrument. It is a reversal pattern featuring the following characteristics: resistance level -1, support level -4, and pattern’s width 9. Forecast If the price breaks through the support level 1.3840, it is likely to move further down to 1.3834.
The M5 and M15 time frames may have more false entry points.
- All
- All
- Bearish Rectangle
- Bearish Symmetrical Triangle
- Bearish Symmetrical Triangle
- Bullish Rectangle
- Double Top
- Double Top
- Triple Bottom
- Triple Bottom
- Triple Top
- Triple Top
- All
- All
- Buy
- Sale
- All
- 1
- 2
- 3
- 4
- 5
Double Top
сформирован 22.05 в 23:00:29 (UTC+0)
сила сигнала 4 из 5
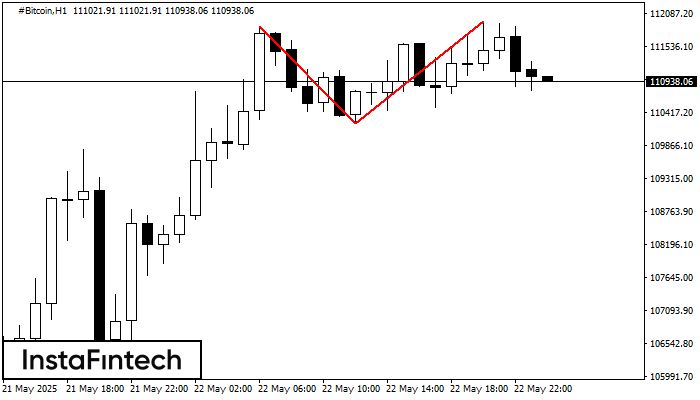
On the chart of #Bitcoin H1 the Double Top reversal pattern has been formed. Characteristics: the upper boundary 111951.72; the lower boundary 110239.46; the width of the pattern 171226 points
Открыть график инструмента в новом окне
Bearish Symmetrical Triangle
сформирован 22.05 в 22:01:48 (UTC+0)
сила сигнала 3 из 5
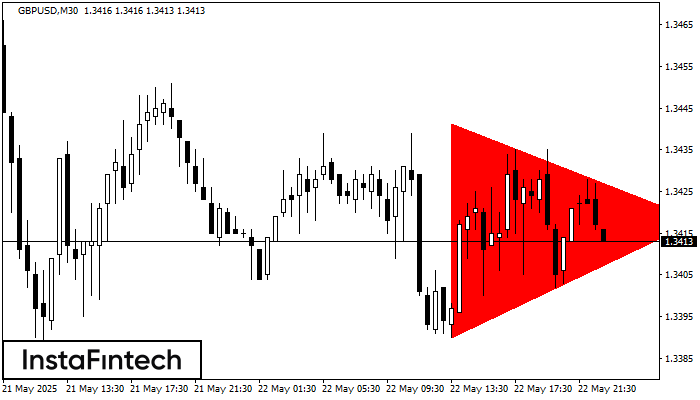
According to the chart of M30, GBPUSD formed the Bearish Symmetrical Triangle pattern. This pattern signals a further downward trend in case the lower border 1.3390 is breached. Here
Открыть график инструмента в новом окне
Bearish Symmetrical Triangle
сформирован 22.05 в 22:01:15 (UTC+0)
сила сигнала 2 из 5
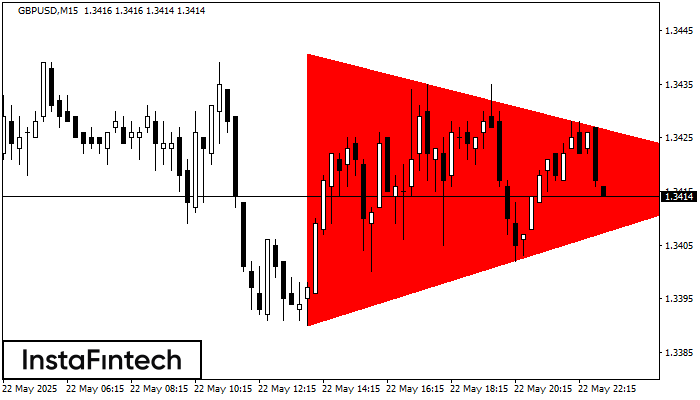
According to the chart of M15, GBPUSD formed the Bearish Symmetrical Triangle pattern. This pattern signals a further downward trend in case the lower border 1.3390 is breached. Here
The M5 and M15 time frames may have more false entry points.
Открыть график инструмента в новом окне


