

Padrões atuais

Padrões são modelos gráficos que são formados no gráfico pelo preço. Segundo um dos postulados da análise técnica, a história (movimento de preços) se repete. Isso significa que os movimentos de preços geralmente são semelhantes nas mesmas situações, o que possibilita prever o desenvolvimento futuro da situação com alta probabilidade.
Os padrões relevantes da InstaTrade são um serviço fácil de usar, que permite que você esteja ciente das últimas mudanças no mercado e reaja a indícios do mercado a tempo. Em nosso serviço, você sempre encontrará os padrões mais recentes e relevantes em qualquer par e em qualquer período gráfico.
Triple Top
was formed on 26.04 at 20:16:22 (UTC+0)
signal strength 1 of 5

On the chart of the #Bitcoin M5 trading instrument, the Triple Top pattern that signals a trend change has formed. It is possible that after formation of the third peak, the price will try to break through the resistance level 94181.05, where we advise to open a trading position for sale. Take profit is the projection of the pattern’s width, which is 13228 points.
The M5 and M15 time frames may have more false entry points.
- All
- All
- Bearish Rectangle
- Bearish Symmetrical Triangle
- Bearish Symmetrical Triangle
- Bullish Rectangle
- Double Top
- Double Top
- Triple Bottom
- Triple Bottom
- Triple Top
- Triple Top
- All
- All
- Buy
- Sale
- All
- 1
- 2
- 3
- 4
- 5
Segitiga Simetris Bearish
was formed on 07.05 at 07:01:12 (UTC+0)
signal strength 2 of 5
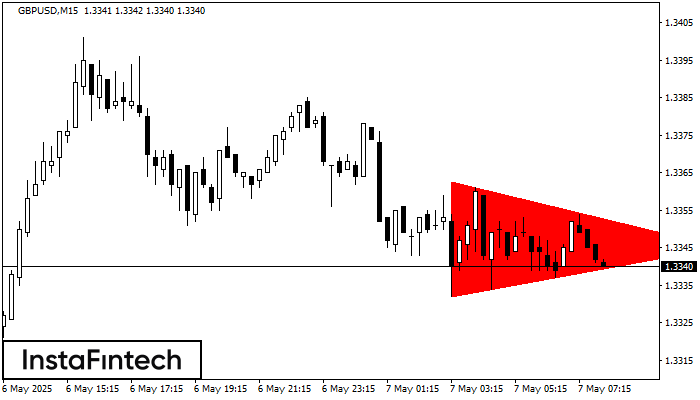
Menurut Grafik dari M15, GBPUSD dibentuk pola Segitiga Simetris Bearish. Deskripsi: Batas yang lebih rendah adalah 1.3332/1.3345 dan batas atas adalah 1.3363/1.3345. Lebar pola diukur dalam grafik di -31 pips
Rangka waktu M5 dan M15 mungkin memiliki lebih dari titik entri yang keliru.
Open chart in a new window
Bawah Ganda
was formed on 07.05 at 06:55:10 (UTC+0)
signal strength 1 of 5
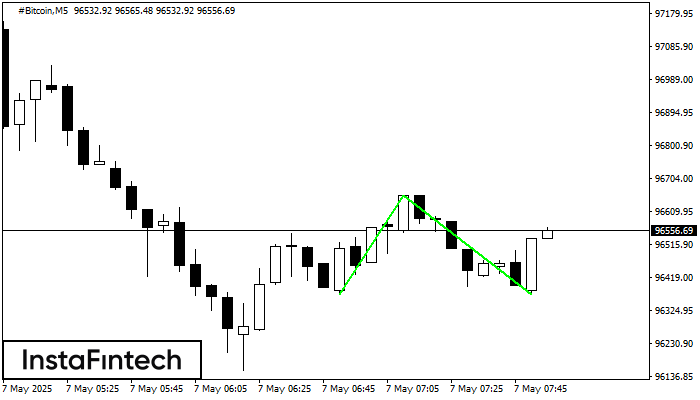
Pola Bawah Ganda telah terbentuk pada #Bitcoin M5. Formasi ini mensinyalkan reversal tren dari arah penurunan ke arah kenaikan. Sinyal menunjukkan bahwa transaksi beli harus dibuka setelah batas atas pola
Rangka waktu M5 dan M15 mungkin memiliki lebih dari titik entri yang keliru.
Open chart in a new window
Segitiga Simetris Bullish
was formed on 07.05 at 06:40:26 (UTC+0)
signal strength 1 of 5
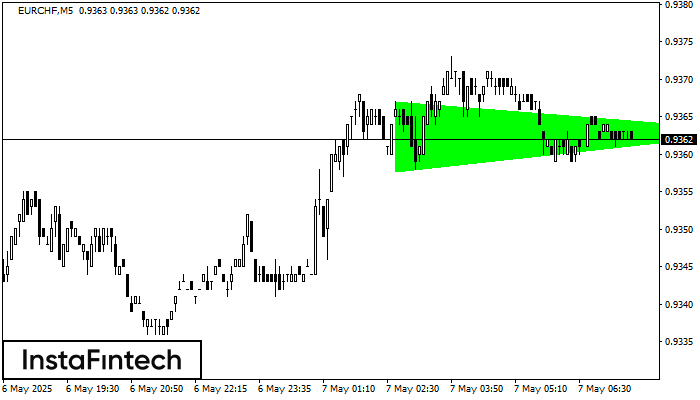
Menurut Grafik dari M5, EURCHF dibentuk pola Segitiga Simetris Bullish. Deskripsi: Ini merupakan pola dari kelanjutan tren. 0.9367 dan 0.9358 adalah kordinat masing-masing dari batas atas dan lebih rendah. Lebar
Rangka waktu M5 dan M15 mungkin memiliki lebih dari titik entri yang keliru.
Open chart in a new window


