

Padrões atuais

Padrões são modelos gráficos que são formados no gráfico pelo preço. Segundo um dos postulados da análise técnica, a história (movimento de preços) se repete. Isso significa que os movimentos de preços geralmente são semelhantes nas mesmas situações, o que possibilita prever o desenvolvimento futuro da situação com alta probabilidade.
Os padrões relevantes da InstaTrade são um serviço fácil de usar, que permite que você esteja ciente das últimas mudanças no mercado e reaja a indícios do mercado a tempo. Em nosso serviço, você sempre encontrará os padrões mais recentes e relevantes em qualquer par e em qualquer período gráfico.
Bullish Symmetrical Triangle
was formed on 16.04 at 05:26:29 (UTC+0)
signal strength 1 of 5
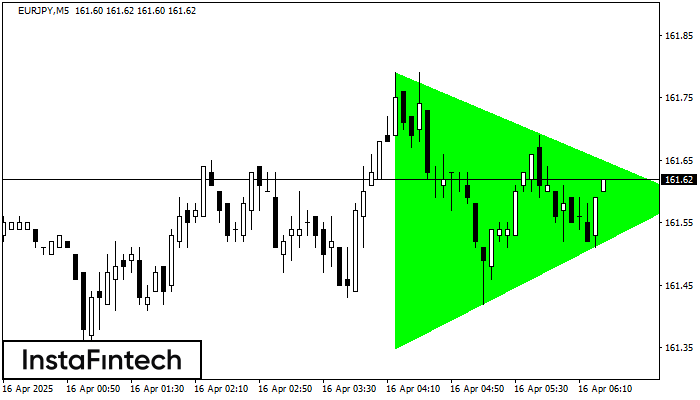
According to the chart of M5, EURJPY formed the Bullish Symmetrical Triangle pattern. The lower border of the pattern touches the coordinates 161.35/161.59 whereas the upper border goes across 161.79/161.59. If the Bullish Symmetrical Triangle pattern is in progress, this evidently signals a further upward trend. In other words, in case the scenario comes true, the price of EURJPY will breach the upper border to head for 161.74.
The M5 and M15 time frames may have more false entry points.
- All
- All
- Bearish Rectangle
- Bearish Symmetrical Triangle
- Bearish Symmetrical Triangle
- Bullish Rectangle
- Double Top
- Double Top
- Triple Bottom
- Triple Bottom
- Triple Top
- Triple Top
- All
- All
- Buy
- Sale
- All
- 1
- 2
- 3
- 4
- 5
Head and Shoulders
сформирован 05.06 в 06:00:32 (UTC+0)
сила сигнала 2 из 5
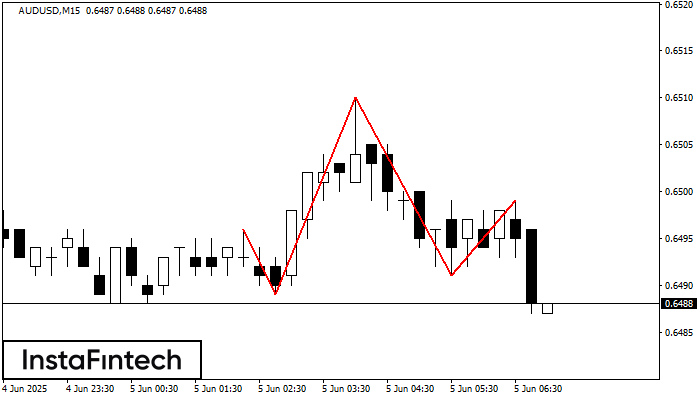
According to the chart of M15, AUDUSD formed the Head and Shoulders pattern. The Head’s top is set at 0.6510 while the median line of the Neck is found
The M5 and M15 time frames may have more false entry points.
Открыть график инструмента в новом окне
Bullish Rectangle
сформирован 05.06 в 05:30:35 (UTC+0)
сила сигнала 2 из 5
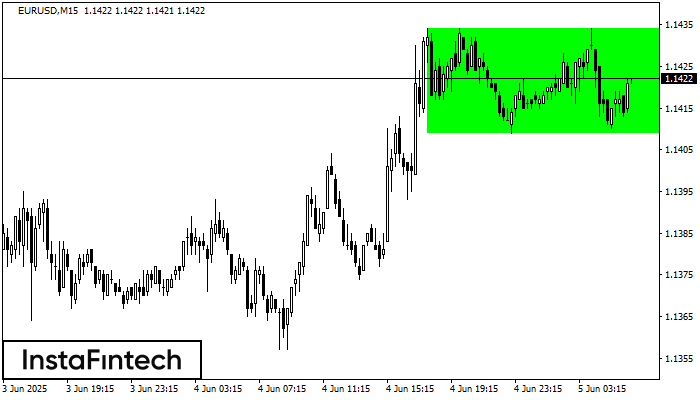
According to the chart of M15, EURUSD formed the Bullish Rectangle. The pattern indicates a trend continuation. The upper border is 1.1434, the lower border is 1.1409. The signal means
The M5 and M15 time frames may have more false entry points.
Открыть график инструмента в новом окне
Head and Shoulders
сформирован 05.06 в 04:45:35 (UTC+0)
сила сигнала 1 из 5
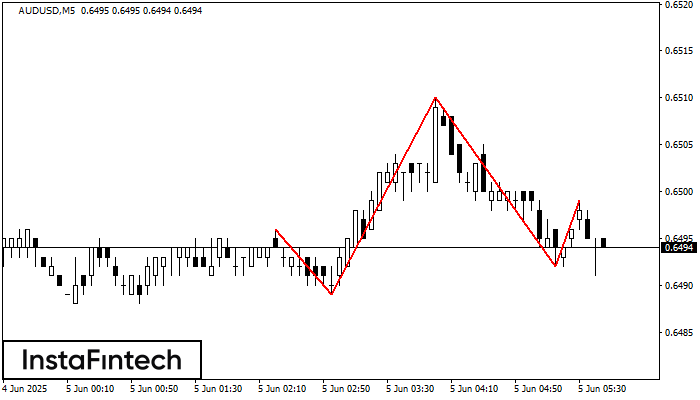
The technical pattern called Head and Shoulders has appeared on the chart of AUDUSD M5. There are weighty reasons to suggest that the price will surpass the Neckline 0.6489/0.6492 after
The M5 and M15 time frames may have more false entry points.
Открыть график инструмента в новом окне


