

Padrões atuais

Padrões são modelos gráficos que são formados no gráfico pelo preço. Segundo um dos postulados da análise técnica, a história (movimento de preços) se repete. Isso significa que os movimentos de preços geralmente são semelhantes nas mesmas situações, o que possibilita prever o desenvolvimento futuro da situação com alta probabilidade.
Os padrões relevantes da InstaTrade são um serviço fácil de usar, que permite que você esteja ciente das últimas mudanças no mercado e reaja a indícios do mercado a tempo. Em nosso serviço, você sempre encontrará os padrões mais recentes e relevantes em qualquer par e em qualquer período gráfico.
Bullish Symmetrical Triangle
was formed on 16.04 at 00:26:32 (UTC+0)
signal strength 1 of 5

According to the chart of M5, USDCHF formed the Bullish Symmetrical Triangle pattern. The lower border of the pattern touches the coordinates 0.8198/0.8221 whereas the upper border goes across 0.8238/0.8221. If the Bullish Symmetrical Triangle pattern is in progress, this evidently signals a further upward trend. In other words, in case the scenario comes true, the price of USDCHF will breach the upper border to head for 0.8236.
The M5 and M15 time frames may have more false entry points.
- All
- All
- Bearish Rectangle
- Bearish Symmetrical Triangle
- Bearish Symmetrical Triangle
- Bullish Rectangle
- Double Top
- Double Top
- Triple Bottom
- Triple Bottom
- Triple Top
- Triple Top
- All
- All
- Buy
- Sale
- All
- 1
- 2
- 3
- 4
- 5
Double Top
was formed on 05.06 at 16:30:32 (UTC+0)
signal strength 4 of 5

The Double Top reversal pattern has been formed on #PEP H1. Characteristics: the upper boundary 132.70; the lower boundary 129.07; the width of the pattern is 365 points. Sell trades
Open chart in a new window
Double Top
was formed on 05.06 at 16:30:13 (UTC+0)
signal strength 4 of 5
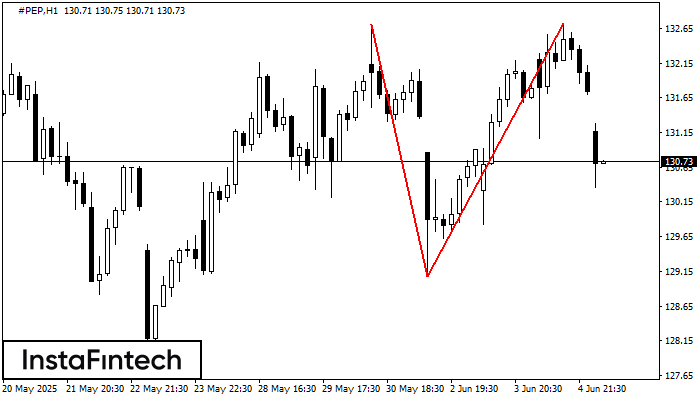
On the chart of #PEP H1 the Double Top reversal pattern has been formed. Characteristics: the upper boundary 132.72; the lower boundary 129.07; the width of the pattern 365 points
Open chart in a new window
Double Top
was formed on 05.06 at 16:00:27 (UTC+0)
signal strength 1 of 5
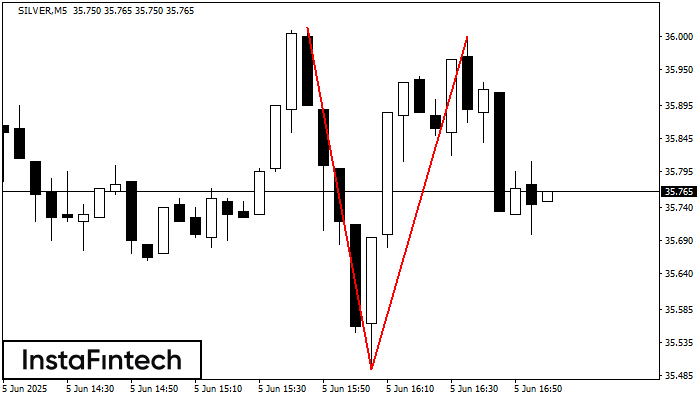
On the chart of SILVER M5 the Double Top reversal pattern has been formed. Characteristics: the upper boundary 36.00; the lower boundary 35.49; the width of the pattern 505 points
The M5 and M15 time frames may have more false entry points.
Open chart in a new window


