

Padrões atuais

Padrões são modelos gráficos que são formados no gráfico pelo preço. Segundo um dos postulados da análise técnica, a história (movimento de preços) se repete. Isso significa que os movimentos de preços geralmente são semelhantes nas mesmas situações, o que possibilita prever o desenvolvimento futuro da situação com alta probabilidade.
Os padrões relevantes da InstaTrade são um serviço fácil de usar, que permite que você esteja ciente das últimas mudanças no mercado e reaja a indícios do mercado a tempo. Em nosso serviço, você sempre encontrará os padrões mais recentes e relevantes em qualquer par e em qualquer período gráfico.
Bullish Rectangle
was formed on 15.04 at 22:01:27 (UTC+0)
signal strength 3 of 5

According to the chart of M30, NZDCHF formed the Bullish Rectangle. This type of a pattern indicates a trend continuation. It consists of two levels: resistance 0.4859 and support 0.4839. In case the resistance level 0.4859 - 0.4859 is broken, the instrument is likely to follow the bullish trend.
- All
- All
- Bearish Rectangle
- Bearish Symmetrical Triangle
- Bearish Symmetrical Triangle
- Bullish Rectangle
- Double Top
- Double Top
- Triple Bottom
- Triple Bottom
- Triple Top
- Triple Top
- All
- All
- Buy
- Sale
- All
- 1
- 2
- 3
- 4
- 5
Fundo triplo
was formed on 03.06 at 00:05:20 (UTC+0)
signal strength 1 of 5

O padrão Fundo triplo foi formado no gráfico de USDJPY M5. Características do padrão: A linha inferior do padrão tem coordenadas 142.75 com o limite superior 142.75/142.69, a projeção
Os intervalos M5 e M15 podem ter mais pontos de entrada falsos.
Open chart in a new window
Fundo triplo
was formed on 03.06 at 00:00:22 (UTC+0)
signal strength 3 of 5
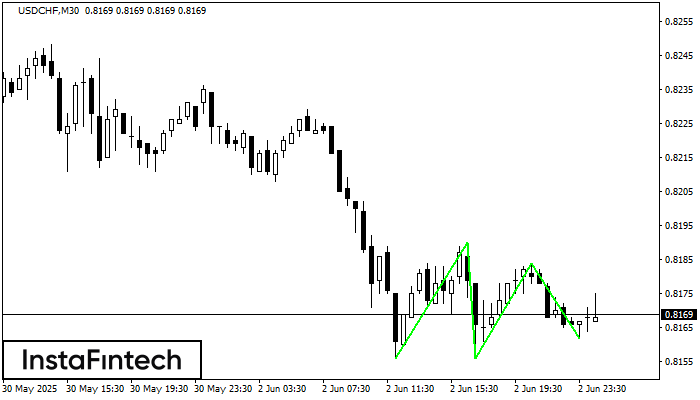
O padrão Fundo triplo foi formado no gráfico do instrumento de negociação USDCHF M30. O padrão sinaliza uma mudança na tendência de baixa para alta no caso de quebra
Open chart in a new window
Cabeça & Ombros
was formed on 02.06 at 23:51:00 (UTC+0)
signal strength 1 of 5
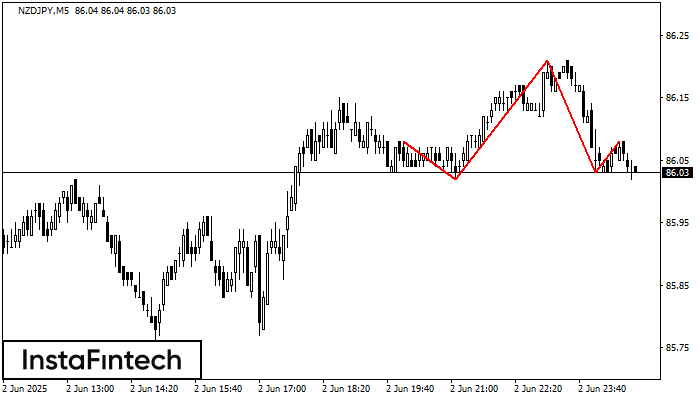
De acordo com o gráfico de M5, NZDJPY formou o padrão Cabeça & Ombros. O topo da Cabeça está definido em 86.21 enquanto a linha mediana do Pescoço é encontrada
Os intervalos M5 e M15 podem ter mais pontos de entrada falsos.
Open chart in a new window


