

Padrões atuais

Padrões são modelos gráficos que são formados no gráfico pelo preço. Segundo um dos postulados da análise técnica, a história (movimento de preços) se repete. Isso significa que os movimentos de preços geralmente são semelhantes nas mesmas situações, o que possibilita prever o desenvolvimento futuro da situação com alta probabilidade.
Os padrões relevantes da InstaTrade são um serviço fácil de usar, que permite que você esteja ciente das últimas mudanças no mercado e reaja a indícios do mercado a tempo. Em nosso serviço, você sempre encontrará os padrões mais recentes e relevantes em qualquer par e em qualquer período gráfico.
Bearish Symmetrical Triangle
was formed on 15.04 at 20:14:46 (UTC+0)
signal strength 1 of 5
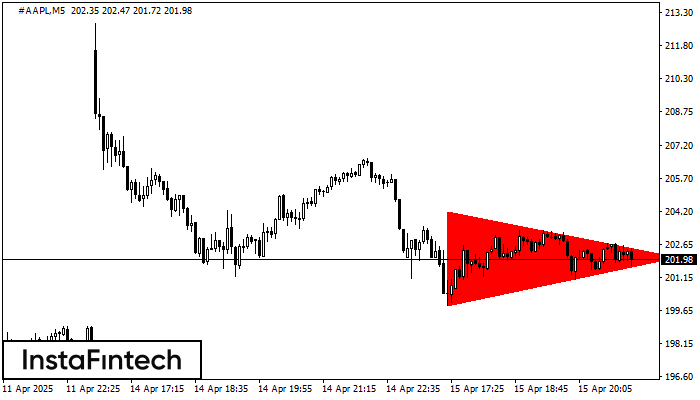
According to the chart of M5, #AAPL formed the Bearish Symmetrical Triangle pattern. Trading recommendations: A breach of the lower border 199.85 is likely to encourage a continuation of the downward trend.
The M5 and M15 time frames may have more false entry points.
- All
- All
- Bearish Rectangle
- Bearish Symmetrical Triangle
- Bearish Symmetrical Triangle
- Bullish Rectangle
- Double Top
- Double Top
- Triple Bottom
- Triple Bottom
- Triple Top
- Triple Top
- All
- All
- Buy
- Sale
- All
- 1
- 2
- 3
- 4
- 5
Fundo triplo
was formed on 28.05 at 21:05:58 (UTC+0)
signal strength 1 of 5
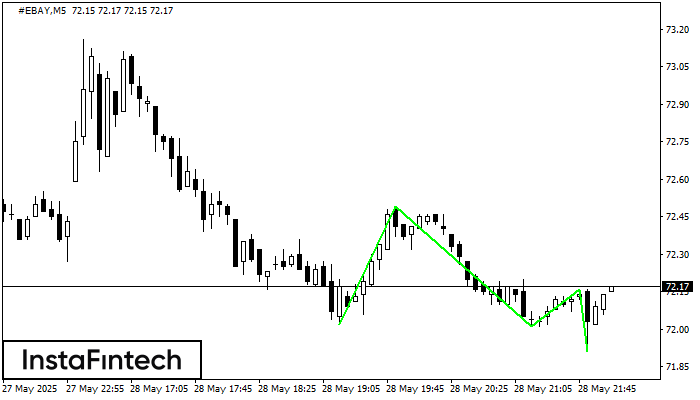
O padrão Fundo triplo foi formado no gráfico do instrumento de negociação #EBAY M5. O padrão sinaliza uma mudança na tendência de baixa para alta no caso de quebra
Os intervalos M5 e M15 podem ter mais pontos de entrada falsos.
Open chart in a new window
Topo duplo
was formed on 28.05 at 21:00:23 (UTC+0)
signal strength 3 of 5
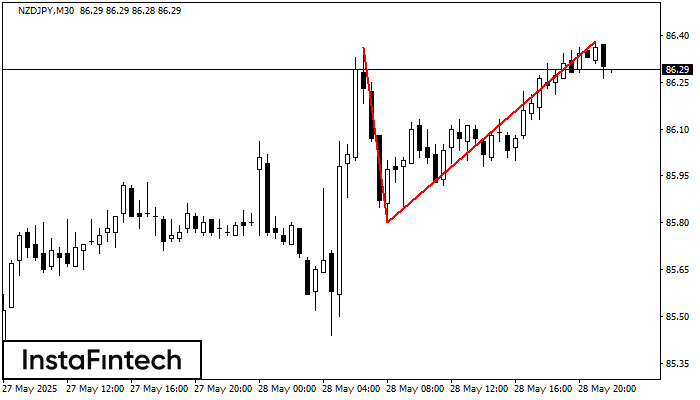
No gráfico de NZDJPY M30 o padrão de reversão Topo duplo foi formado. Características: o limite superior 86.38; o limite inferior 85.80; a largura do padrão 58 pontos. O sinal
Open chart in a new window
Fundo duplo
was formed on 28.05 at 20:55:28 (UTC+0)
signal strength 1 of 5
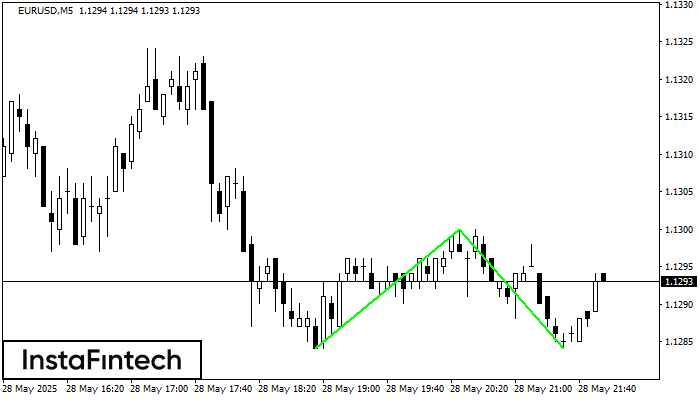
O padrão Fundo duplo foi formado em EURUSD M5. Características: o nível de suporte 1.1284; o nível de resistência 1.1300; a largura do padrão 16 pontos. Se o nível
Os intervalos M5 e M15 podem ter mais pontos de entrada falsos.
Open chart in a new window


