

Padrões atuais

Padrões são modelos gráficos que são formados no gráfico pelo preço. Segundo um dos postulados da análise técnica, a história (movimento de preços) se repete. Isso significa que os movimentos de preços geralmente são semelhantes nas mesmas situações, o que possibilita prever o desenvolvimento futuro da situação com alta probabilidade.
Os padrões relevantes da InstaTrade são um serviço fácil de usar, que permite que você esteja ciente das últimas mudanças no mercado e reaja a indícios do mercado a tempo. Em nosso serviço, você sempre encontrará os padrões mais recentes e relevantes em qualquer par e em qualquer período gráfico.
Bearish Symmetrical Triangle
was formed on 14.04 at 21:53:03 (UTC+0)
signal strength 1 of 5
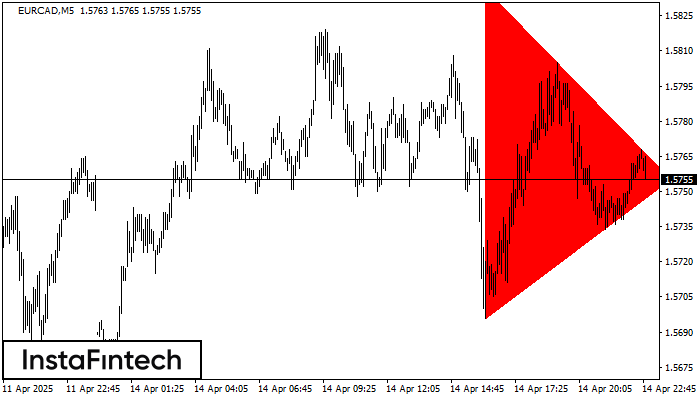
According to the chart of M5, EURCAD formed the Bearish Symmetrical Triangle pattern. This pattern signals a further downward trend in case the lower border 1.5696 is breached. Here, a hypothetical profit will equal the width of the available pattern that is -141 pips.
The M5 and M15 time frames may have more false entry points.
- All
- All
- Bearish Rectangle
- Bearish Symmetrical Triangle
- Bearish Symmetrical Triangle
- Bullish Rectangle
- Double Top
- Double Top
- Triple Bottom
- Triple Bottom
- Triple Top
- Triple Top
- All
- All
- Buy
- Sale
- All
- 1
- 2
- 3
- 4
- 5
Triângulo Simétrico de Baixa
was formed on 04.06 at 04:16:58 (UTC+0)
signal strength 2 of 5
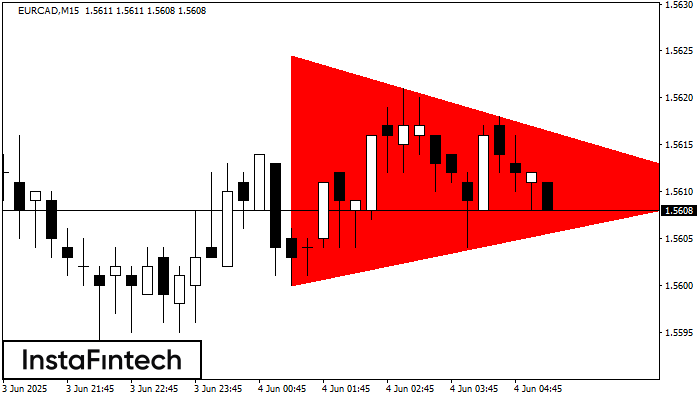
De acordo com o gráfico de M15, EURCAD fomrou o padrão de Triângulo Simétrico de Baixa. Este padrão sinaliza uma nova tendência de baixa se o limite inferior 1.5600
Os intervalos M5 e M15 podem ter mais pontos de entrada falsos.
Open chart in a new window
Topo duplo
was formed on 04.06 at 04:00:27 (UTC+0)
signal strength 3 of 5
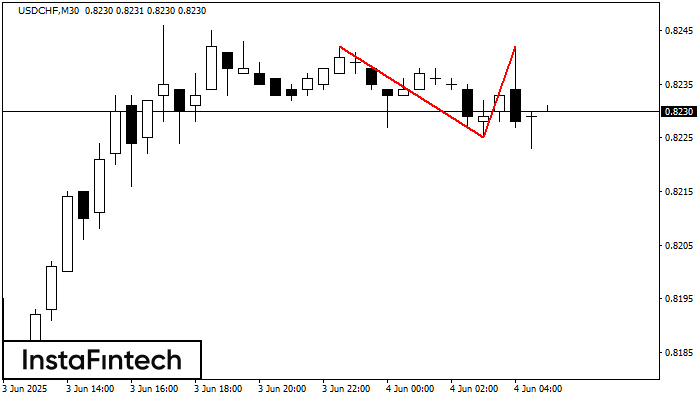
O padrão de reversão Topo duplo foi formado em USDCHF M30. Características: o limite superior 0.8242; o limite inferior 0.8225; a largura do padrão é de 17 pontos. As operações
Open chart in a new window
Topo triplo
was formed on 04.06 at 04:00:18 (UTC+0)
signal strength 3 of 5
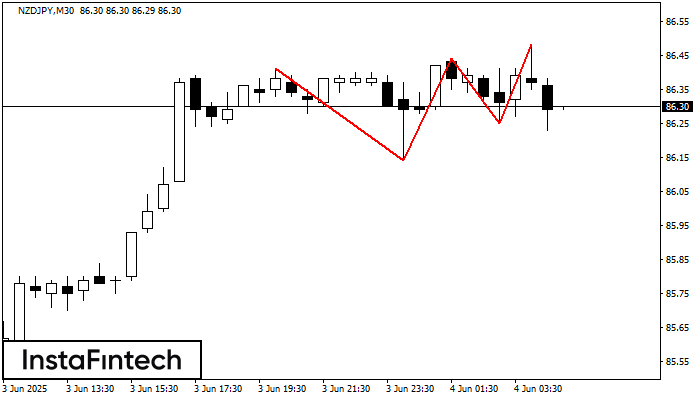
O padrão Topo triplo foi formado no gráfico do instrumento de negociação NZDJPY M30. É um padrão de reversão com as seguintes características: nível de resistência -7, nível de suporte
Open chart in a new window


