

Padrões atuais

Padrões são modelos gráficos que são formados no gráfico pelo preço. Segundo um dos postulados da análise técnica, a história (movimento de preços) se repete. Isso significa que os movimentos de preços geralmente são semelhantes nas mesmas situações, o que possibilita prever o desenvolvimento futuro da situação com alta probabilidade.
Os padrões relevantes da InstaTrade são um serviço fácil de usar, que permite que você esteja ciente das últimas mudanças no mercado e reaja a indícios do mercado a tempo. Em nosso serviço, você sempre encontrará os padrões mais recentes e relevantes em qualquer par e em qualquer período gráfico.
Double Bottom
was formed on 14.04 at 20:00:18 (UTC+0)
signal strength 2 of 5
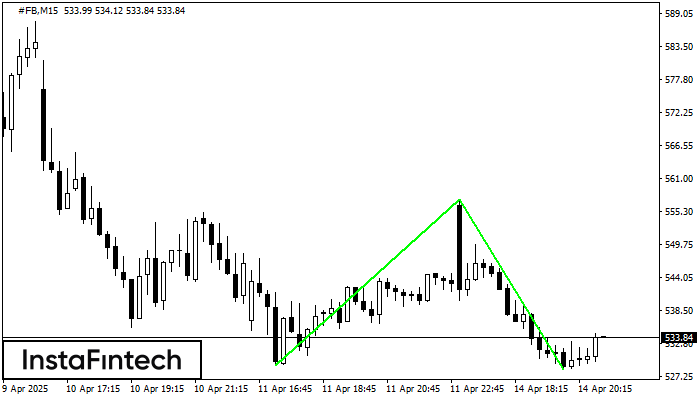
The Double Bottom pattern has been formed on #FB M15. Characteristics: the support level 529.17; the resistance level 557.42; the width of the pattern 2825 points. If the resistance level is broken, a change in the trend can be predicted with the first target point lying at the distance of 2905 points.
The M5 and M15 time frames may have more false entry points.
- All
- All
- Bearish Rectangle
- Bearish Symmetrical Triangle
- Bearish Symmetrical Triangle
- Bullish Rectangle
- Double Top
- Double Top
- Triple Bottom
- Triple Bottom
- Triple Top
- Triple Top
- All
- All
- Buy
- Sale
- All
- 1
- 2
- 3
- 4
- 5
Pennant de baixa
was formed on 28.05 at 04:02:50 (UTC+0)
signal strength 1 of 5
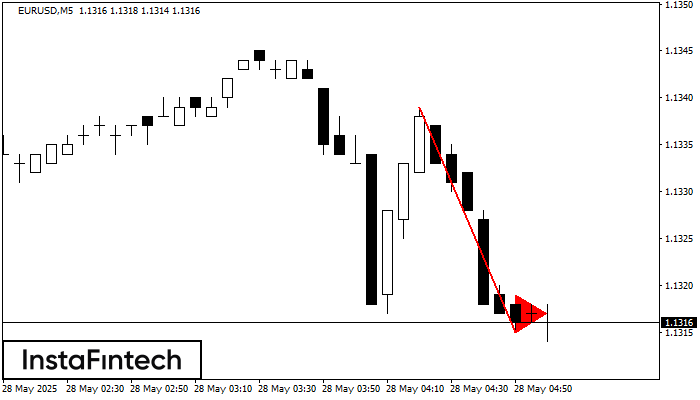
O padrão Pennant de baixa foi formado no gráfico EURUSD M5. O padrão sinaliza a continuação da tendência de baixa caso o pennant de baixa de 1.1315 for quebrada. Recomendações
Os intervalos M5 e M15 podem ter mais pontos de entrada falsos.
Open chart in a new window
Retângulo de alta
was formed on 28.05 at 03:30:25 (UTC+0)
signal strength 2 of 5
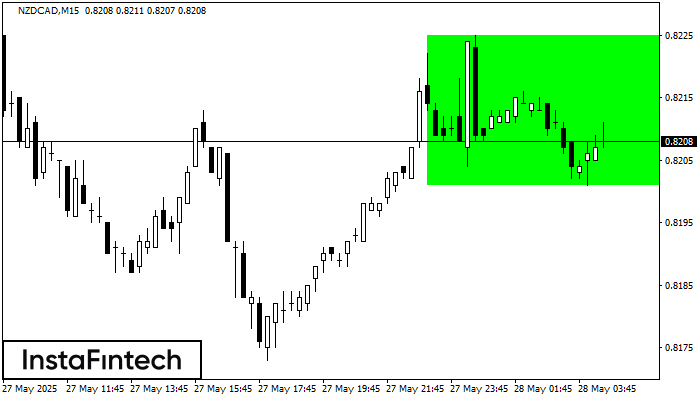
Conforme o gráfico de M15, NZDCAD formou o Retângulo de alta. Este tipo de padrão indica uma continuação da tendência. Ele consiste em dois níveis: resistência 0.8225 e suporte 0.8201
Os intervalos M5 e M15 podem ter mais pontos de entrada falsos.
Open chart in a new window
Topo triplo
was formed on 28.05 at 03:01:28 (UTC+0)
signal strength 3 of 5
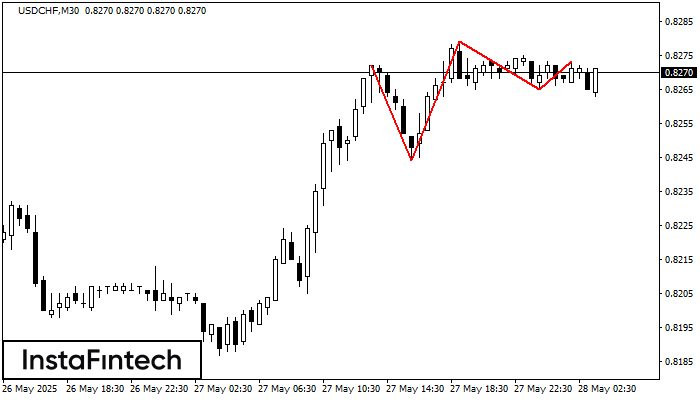
O padrão Topo triplo foi formado no gráfico do instrumento de negociação USDCHF M30. É um padrão de reversão com as seguintes características: nível de resistência -1, nível de suporte
Open chart in a new window


