

Padrões atuais

Padrões são modelos gráficos que são formados no gráfico pelo preço. Segundo um dos postulados da análise técnica, a história (movimento de preços) se repete. Isso significa que os movimentos de preços geralmente são semelhantes nas mesmas situações, o que possibilita prever o desenvolvimento futuro da situação com alta probabilidade.
Os padrões relevantes da InstaTrade são um serviço fácil de usar, que permite que você esteja ciente das últimas mudanças no mercado e reaja a indícios do mercado a tempo. Em nosso serviço, você sempre encontrará os padrões mais recentes e relevantes em qualquer par e em qualquer período gráfico.
Double Top
was formed on 14.04 at 12:20:34 (UTC+0)
signal strength 1 of 5
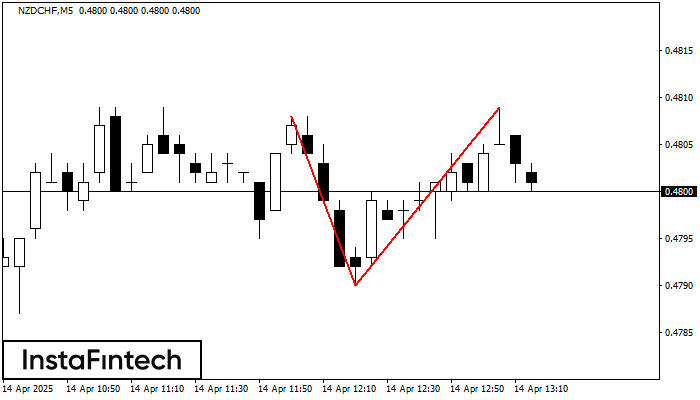
On the chart of NZDCHF M5 the Double Top reversal pattern has been formed. Characteristics: the upper boundary 0.4809; the lower boundary 0.4790; the width of the pattern 19 points. The signal: a break of the lower boundary will cause continuation of the downward trend targeting the 0.4775 level.
The M5 and M15 time frames may have more false entry points.
- All
- All
- Bearish Rectangle
- Bearish Symmetrical Triangle
- Bearish Symmetrical Triangle
- Bullish Rectangle
- Double Top
- Double Top
- Triple Bottom
- Triple Bottom
- Triple Top
- Triple Top
- All
- All
- Buy
- Sale
- All
- 1
- 2
- 3
- 4
- 5
Triple Top
was formed on 02.06 at 23:11:50 (UTC+0)
signal strength 1 of 5
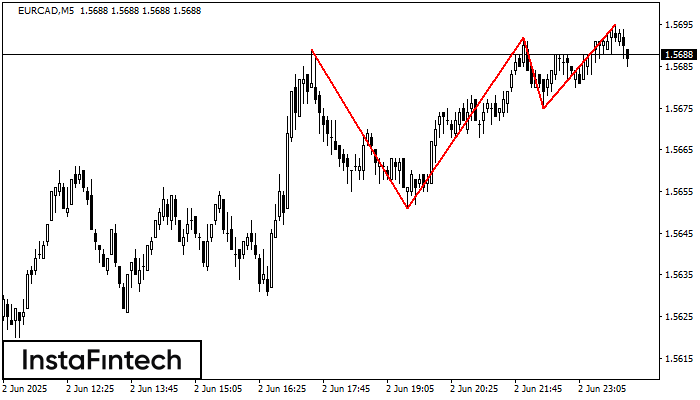
The Triple Top pattern has formed on the chart of the EURCAD M5. Features of the pattern: borders have an ascending angle; the lower line of the pattern
The M5 and M15 time frames may have more false entry points.
Open chart in a new window
Double Top
was formed on 02.06 at 23:00:37 (UTC+0)
signal strength 5 of 5
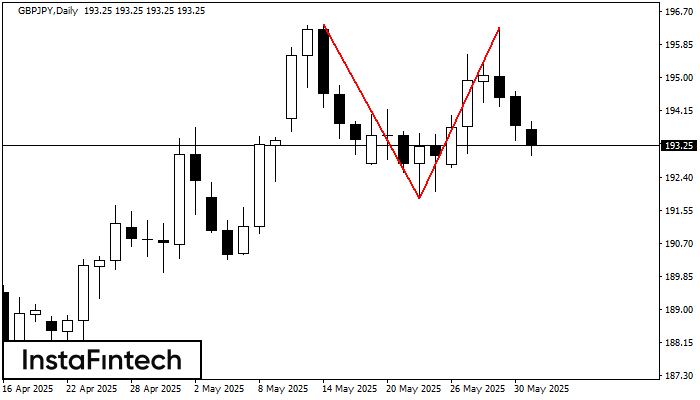
The Double Top reversal pattern has been formed on GBPJPY D1. Characteristics: the upper boundary 196.38; the lower boundary 191.87; the width of the pattern is 441 points. Sell trades
Open chart in a new window
Double Bottom
was formed on 02.06 at 23:00:22 (UTC+0)
signal strength 2 of 5
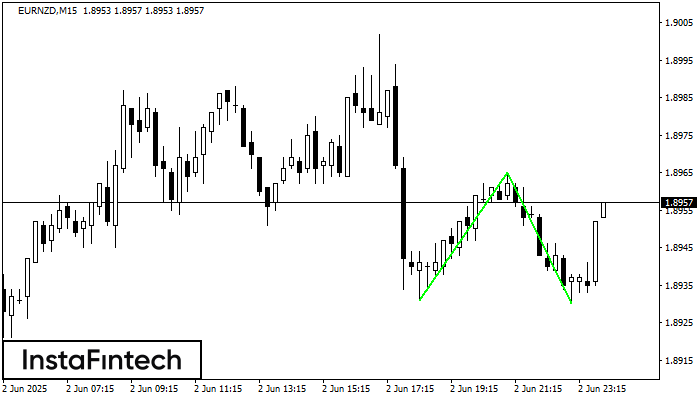
The Double Bottom pattern has been formed on EURNZD M15. Characteristics: the support level 1.8931; the resistance level 1.8965; the width of the pattern 34 points. If the resistance level
The M5 and M15 time frames may have more false entry points.
Open chart in a new window


