

Padrões atuais

Padrões são modelos gráficos que são formados no gráfico pelo preço. Segundo um dos postulados da análise técnica, a história (movimento de preços) se repete. Isso significa que os movimentos de preços geralmente são semelhantes nas mesmas situações, o que possibilita prever o desenvolvimento futuro da situação com alta probabilidade.
Os padrões relevantes da InstaTrade são um serviço fácil de usar, que permite que você esteja ciente das últimas mudanças no mercado e reaja a indícios do mercado a tempo. Em nosso serviço, você sempre encontrará os padrões mais recentes e relevantes em qualquer par e em qualquer período gráfico.
Triple Bottom
was formed on 14.04 at 06:15:49 (UTC+0)
signal strength 1 of 5
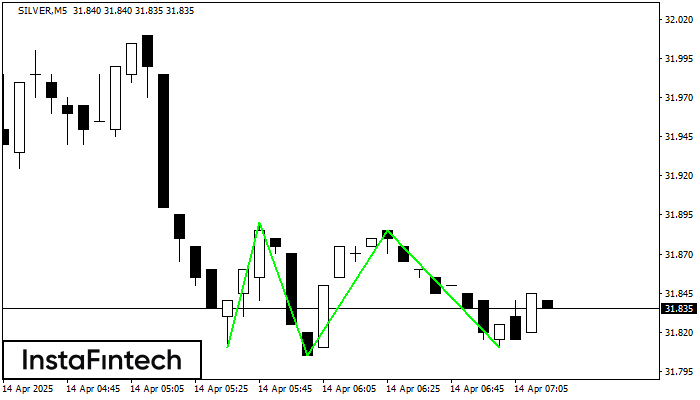
The Triple Bottom pattern has formed on the chart of the SILVER M5 trading instrument. The pattern signals a change in the trend from downwards to upwards in the case of breakdown of 31.89/31.89.
The M5 and M15 time frames may have more false entry points.
Veja também
- All
- All
- Bearish Rectangle
- Bearish Symmetrical Triangle
- Bearish Symmetrical Triangle
- Bullish Rectangle
- Double Top
- Double Top
- Triple Bottom
- Triple Bottom
- Triple Top
- Triple Top
- All
- All
- Buy
- Sale
- All
- 1
- 2
- 3
- 4
- 5
Double Top
was formed on 06.06 at 05:05:28 (UTC+0)
signal strength 1 of 5
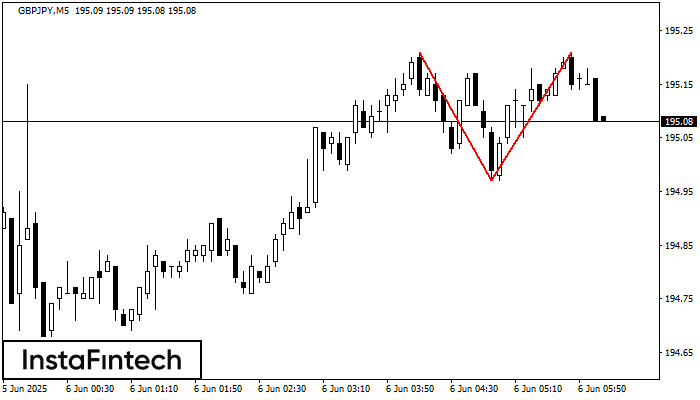
The Double Top reversal pattern has been formed on GBPJPY M5. Characteristics: the upper boundary 195.21; the lower boundary 194.97; the width of the pattern is 24 points. Sell trades
The M5 and M15 time frames may have more false entry points.
Open chart in a new window
Head and Shoulders
was formed on 06.06 at 05:01:27 (UTC+0)
signal strength 4 of 5
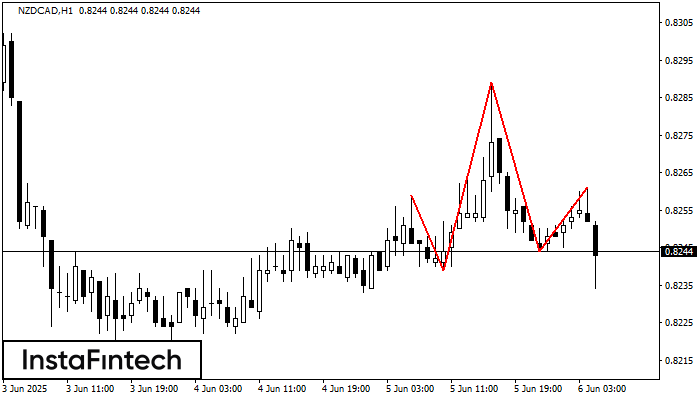
The technical pattern called Head and Shoulders has appeared on the chart of NZDCAD H1. There are weighty reasons to suggest that the price will surpass the Neckline 0.8239/0.8244 after
Open chart in a new window
Inverse Head and Shoulder
was formed on 06.06 at 05:00:19 (UTC+0)
signal strength 4 of 5
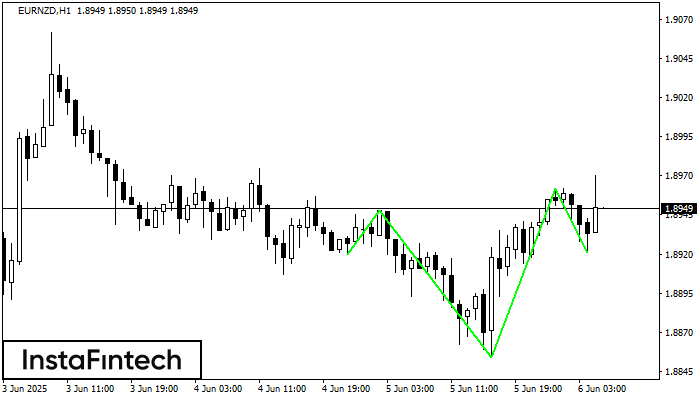
According to H1, EURNZD is shaping the technical pattern – the Inverse Head and Shoulder. In case the Neckline 1.8948/1.8962 is broken out, the instrument is likely to move toward
Open chart in a new window


