

Padrões atuais

Padrões são modelos gráficos que são formados no gráfico pelo preço. Segundo um dos postulados da análise técnica, a história (movimento de preços) se repete. Isso significa que os movimentos de preços geralmente são semelhantes nas mesmas situações, o que possibilita prever o desenvolvimento futuro da situação com alta probabilidade.
Os padrões relevantes da InstaTrade são um serviço fácil de usar, que permite que você esteja ciente das últimas mudanças no mercado e reaja a indícios do mercado a tempo. Em nosso serviço, você sempre encontrará os padrões mais recentes e relevantes em qualquer par e em qualquer período gráfico.
Bullish Flag
was formed on 14.04 at 00:04:23 (UTC+0)
signal strength 2 of 5

The Bullish Flag pattern has been formed on the chart AUDJPY M15 which signals that the upward trend will continue. Signals: а break of the peak at 90.88 may push the price higher, and the rise will be the projection of the pole.
The M5 and M15 time frames may have more false entry points.
Veja também
- All
- All
- Bearish Rectangle
- Bearish Symmetrical Triangle
- Bearish Symmetrical Triangle
- Bullish Rectangle
- Double Top
- Double Top
- Triple Bottom
- Triple Bottom
- Triple Top
- Triple Top
- All
- All
- Buy
- Sale
- All
- 1
- 2
- 3
- 4
- 5
Double Bottom
was formed on 06.06 at 10:35:21 (UTC+0)
signal strength 1 of 5
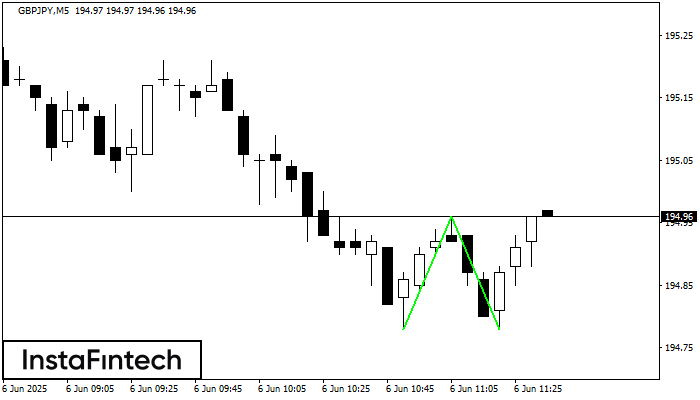
The Double Bottom pattern has been formed on GBPJPY M5. Characteristics: the support level 194.78; the resistance level 194.96; the width of the pattern 18 points. If the resistance level
The M5 and M15 time frames may have more false entry points.
Open chart in a new window
Double Bottom
was formed on 06.06 at 10:30:27 (UTC+0)
signal strength 1 of 5
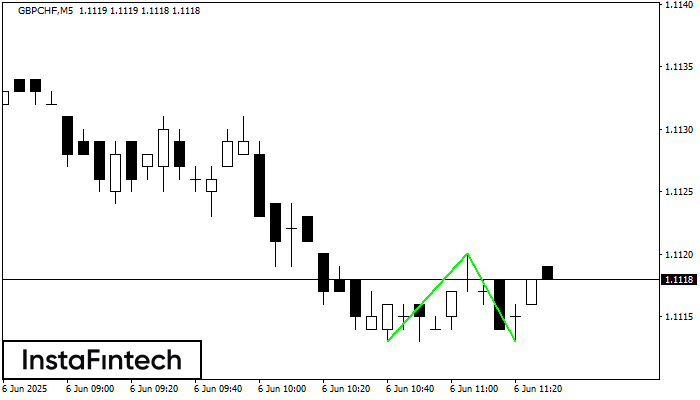
The Double Bottom pattern has been formed on GBPCHF M5; the upper boundary is 1.1120; the lower boundary is 1.1113. The width of the pattern is 7 points. In case
The M5 and M15 time frames may have more false entry points.
Open chart in a new window
Double Top
was formed on 06.06 at 10:30:10 (UTC+0)
signal strength 3 of 5
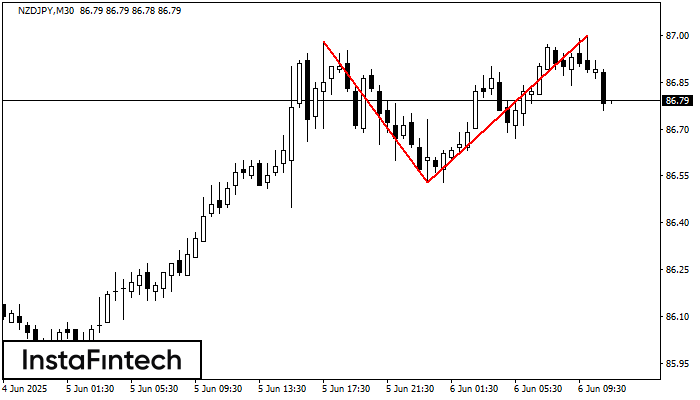
The Double Top reversal pattern has been formed on NZDJPY M30. Characteristics: the upper boundary 86.98; the lower boundary 86.53; the width of the pattern is 47 points. Sell trades
Open chart in a new window


