

Padrões atuais

Padrões são modelos gráficos que são formados no gráfico pelo preço. Segundo um dos postulados da análise técnica, a história (movimento de preços) se repete. Isso significa que os movimentos de preços geralmente são semelhantes nas mesmas situações, o que possibilita prever o desenvolvimento futuro da situação com alta probabilidade.
Os padrões relevantes da InstaTrade são um serviço fácil de usar, que permite que você esteja ciente das últimas mudanças no mercado e reaja a indícios do mercado a tempo. Em nosso serviço, você sempre encontrará os padrões mais recentes e relevantes em qualquer par e em qualquer período gráfico.
Double Top
was formed on 04.04 at 07:20:16 (UTC+0)
signal strength 1 of 5
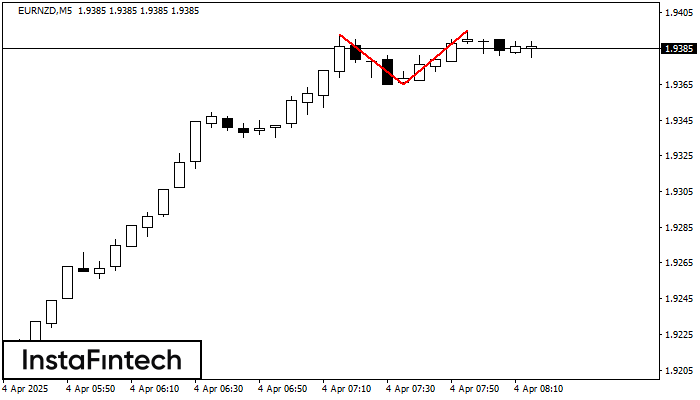
The Double Top reversal pattern has been formed on EURNZD M5. Characteristics: the upper boundary 1.9393; the lower boundary 1.9365; the width of the pattern is 30 points. Sell trades are better to be opened below the lower boundary 1.9365 with a possible movements towards the 1.9350 level.
The M5 and M15 time frames may have more false entry points.
- All
- All
- Bearish Rectangle
- Bearish Symmetrical Triangle
- Bearish Symmetrical Triangle
- Bullish Rectangle
- Double Top
- Double Top
- Triple Bottom
- Triple Bottom
- Triple Top
- Triple Top
- All
- All
- Buy
- Sale
- All
- 1
- 2
- 3
- 4
- 5
Bawah Ganda
was formed on 12.05 at 14:45:17 (UTC+0)
signal strength 1 of 5
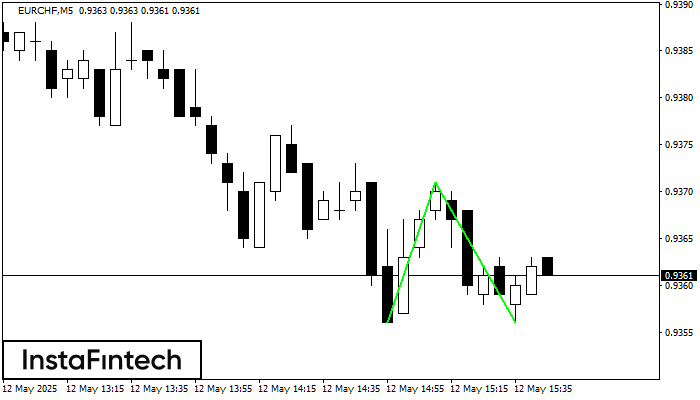
Pola Bawah Ganda telah terbentuk pada EURCHF M5; batas atas di 0.9371; batas bawah di 0.9356. Lebar pola sebesar 15 poin. Jika harga menembus batas atas 0.9371, Perubahan dalam tren
Rangka waktu M5 dan M15 mungkin memiliki lebih dari titik entri yang keliru.
Open chart in a new window
Persegi Bullish
was formed on 12.05 at 14:12:31 (UTC+0)
signal strength 1 of 5
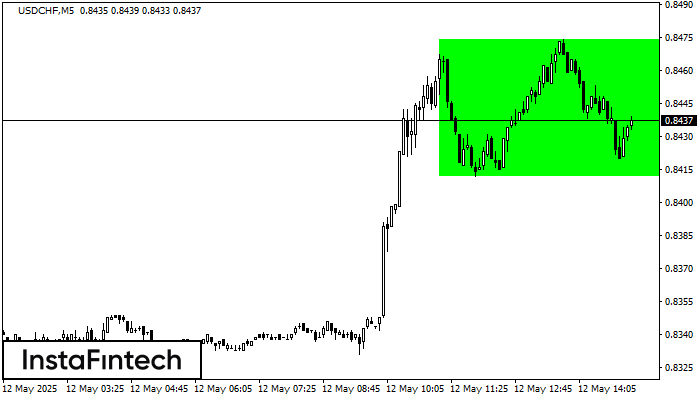
Menurut grafik dari M5, USDCHF terbentuk Persegi Bullish. Pola menunjukkan kelanjutan tren. Batas atas adalah 0.8474, batas lebih rendah adalah 0.8412. Sinyal berarti posisi beli harus dibuka diatas batas atas
Rangka waktu M5 dan M15 mungkin memiliki lebih dari titik entri yang keliru.
Open chart in a new window
Persegi Bearish
was formed on 12.05 at 14:12:00 (UTC+0)
signal strength 1 of 5
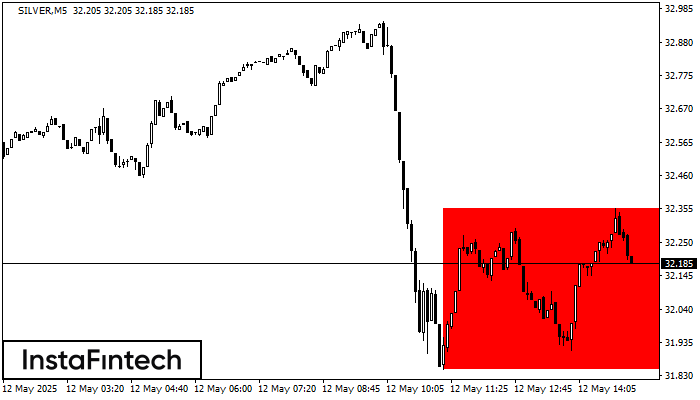
Menurut grafik dari M5, SILVER terbentuk Persegi Bearish. Pola menunjukkan kelanjutan tren. Batas atas adalah 32.35, batas rendah adalah 31.85. Sinyal berarti posisi jual harus dibuka setelah menetapkan harga dibawah
Rangka waktu M5 dan M15 mungkin memiliki lebih dari titik entri yang keliru.
Open chart in a new window


