

Padrões atuais

Padrões são modelos gráficos que são formados no gráfico pelo preço. Segundo um dos postulados da análise técnica, a história (movimento de preços) se repete. Isso significa que os movimentos de preços geralmente são semelhantes nas mesmas situações, o que possibilita prever o desenvolvimento futuro da situação com alta probabilidade.
Os padrões relevantes da InstaTrade são um serviço fácil de usar, que permite que você esteja ciente das últimas mudanças no mercado e reaja a indícios do mercado a tempo. Em nosso serviço, você sempre encontrará os padrões mais recentes e relevantes em qualquer par e em qualquer período gráfico.
Triple Bottom
was formed on 03.04 at 23:00:23 (UTC+0)
signal strength 1 of 5
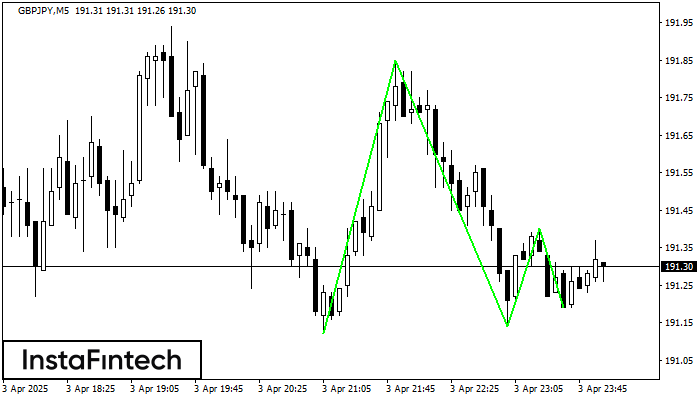
The Triple Bottom pattern has formed on the chart of GBPJPY M5. Features of the pattern: The lower line of the pattern has coordinates 191.85 with the upper limit 191.85/191.40, the projection of the width is 73 points. The formation of the Triple Bottom pattern most likely indicates a change in the trend from downward to upward. This means that in the event of a breakdown of the resistance level 191.12, the price is most likely to continue the upward movement.
The M5 and M15 time frames may have more false entry points.
- All
- All
- Bearish Rectangle
- Bearish Symmetrical Triangle
- Bearish Symmetrical Triangle
- Bullish Rectangle
- Double Top
- Double Top
- Triple Bottom
- Triple Bottom
- Triple Top
- Triple Top
- All
- All
- Buy
- Sale
- All
- 1
- 2
- 3
- 4
- 5
Прямоугольник
сформирован 09.06 в 08:45:29 (UTC+0)
сила сигнала 2 из 5
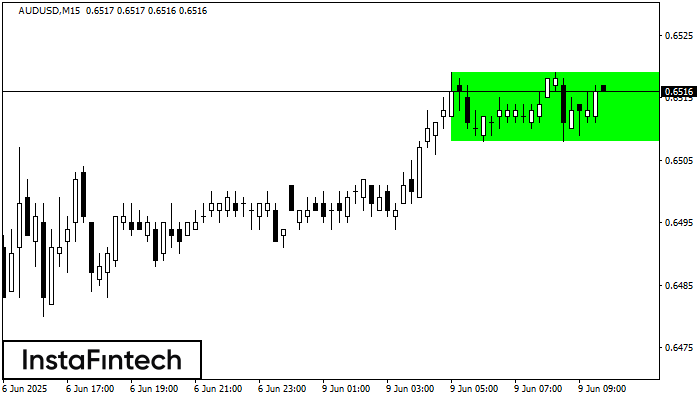
По торговому инструменту AUDUSD на M15 сформировалась фигура продолжения тренда - «Прямоугольник». Фигура имеет границы: Нижняя 0.6508; Верхняя 0.6519. В случае пробоя верхней границы вероятно дальнейшее движение в сторону тренда
Таймфреймы М5 и М15 могут иметь больше ложных точек входа.
Открыть график инструмента в новом окне
Голова и плечи
сформирован 09.06 в 08:30:24 (UTC+0)
сила сигнала 3 из 5
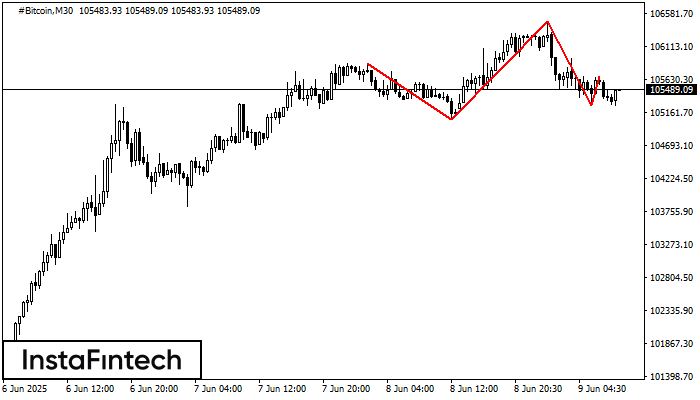
По #Bitcoin на M30 сформировалась фигура «Голова и плечи». Вершина головы закреплена на 106466.59, при этом средняя линия шеи расположена на 105061.92/105266.00. Формирование фигуры «Голова и плечи» наиболее вероятным образом
Открыть график инструмента в новом окне
Двойное дно
сформирован 09.06 в 08:30:24 (UTC+0)
сила сигнала 2 из 5
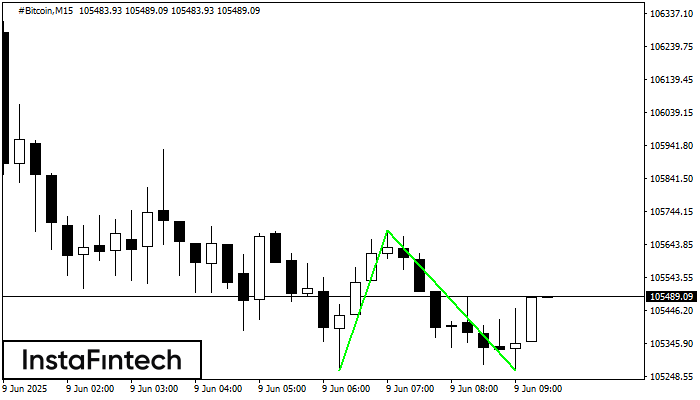
Сформирована фигура «Двойное дно» на графике #Bitcoin M15. Характеристика: Уровень поддержки 105266.00; Уровень сопротивления 105685.24; Ширина фигуры 41924 пунктов. В случае пробоя уровня сопротивления можно будет прогнозировать изменение тенденции
Таймфреймы М5 и М15 могут иметь больше ложных точек входа.
Открыть график инструмента в новом окне


