

Padrões atuais

Padrões são modelos gráficos que são formados no gráfico pelo preço. Segundo um dos postulados da análise técnica, a história (movimento de preços) se repete. Isso significa que os movimentos de preços geralmente são semelhantes nas mesmas situações, o que possibilita prever o desenvolvimento futuro da situação com alta probabilidade.
Os padrões relevantes da InstaTrade são um serviço fácil de usar, que permite que você esteja ciente das últimas mudanças no mercado e reaja a indícios do mercado a tempo. Em nosso serviço, você sempre encontrará os padrões mais recentes e relevantes em qualquer par e em qualquer período gráfico.
Bearish pennant
was formed on 03.04 at 15:29:56 (UTC+0)
signal strength 1 of 5
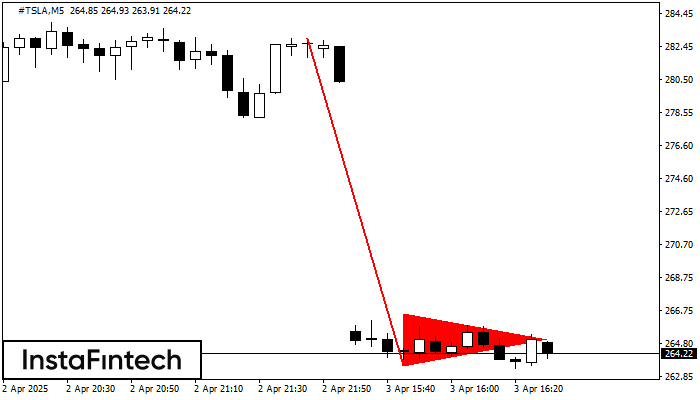
The Bearish pennant pattern has formed on the #TSLA M5 chart. This pattern type is characterized by a slight slowdown after which the price will move in the direction of the original trend. In case the price fixes below the pattern’s low of 263.52, a trader will be able to successfully enter the sell position.
The M5 and M15 time frames may have more false entry points.
Veja também
- All
- All
- Bearish Rectangle
- Bearish Symmetrical Triangle
- Bearish Symmetrical Triangle
- Bullish Rectangle
- Double Top
- Double Top
- Triple Bottom
- Triple Bottom
- Triple Top
- Triple Top
- All
- All
- Buy
- Sale
- All
- 1
- 2
- 3
- 4
- 5
Retângulo de baixa
was formed on 30.05 at 13:12:54 (UTC+0)
signal strength 1 of 5
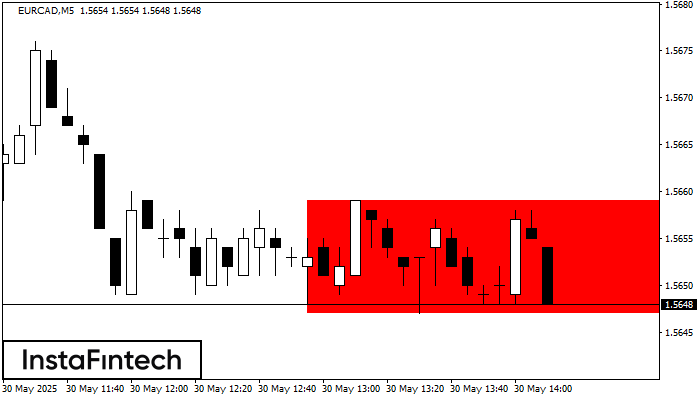
De acordo com o gráfico de M5, EURCAD formou Retângulo de baixa. O padrão indica uma continuação da tendência. O limite superior é 1.5659, o limite inferior é 1.5647
Os intervalos M5 e M15 podem ter mais pontos de entrada falsos.
Open chart in a new window
Fundo duplo
was formed on 30.05 at 12:31:28 (UTC+0)
signal strength 3 of 5
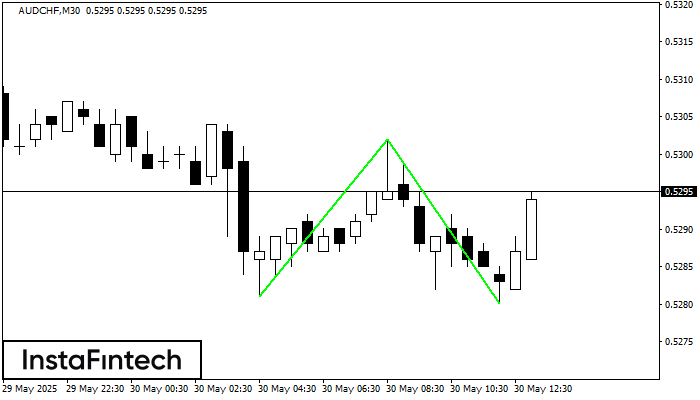
O padrão Fundo duplo foi formado em AUDCHF M30. Características: o nível de suporte 0.5281; o nível de resistência 0.5302; a largura do padrão 21 pontos. Se o nível
Open chart in a new window
Fundo duplo
was formed on 30.05 at 12:00:29 (UTC+0)
signal strength 2 of 5
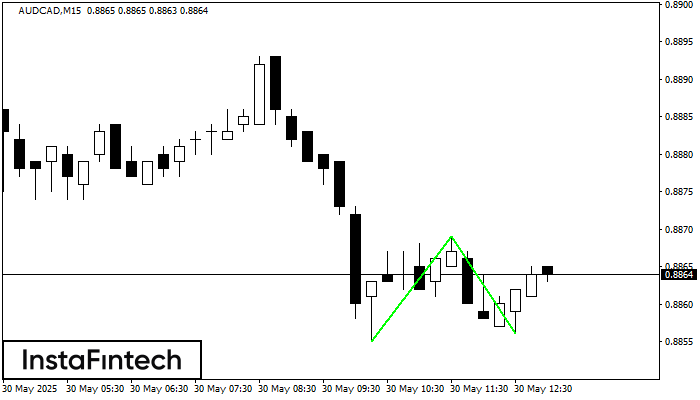
O padrão Fundo duplo foi formado em AUDCAD M15; o limite superior é 0.8869; o limite inferior é 0.8856. A largura do padrão é de 14 pontos. No caso
Os intervalos M5 e M15 podem ter mais pontos de entrada falsos.
Open chart in a new window


