

Padrões atuais

Padrões são modelos gráficos que são formados no gráfico pelo preço. Segundo um dos postulados da análise técnica, a história (movimento de preços) se repete. Isso significa que os movimentos de preços geralmente são semelhantes nas mesmas situações, o que possibilita prever o desenvolvimento futuro da situação com alta probabilidade.
Os padrões relevantes da InstaTrade são um serviço fácil de usar, que permite que você esteja ciente das últimas mudanças no mercado e reaja a indícios do mercado a tempo. Em nosso serviço, você sempre encontrará os padrões mais recentes e relevantes em qualquer par e em qualquer período gráfico.
Bullish Symmetrical Triangle
was formed on 03.04 at 14:46:11 (UTC+0)
signal strength 1 of 5
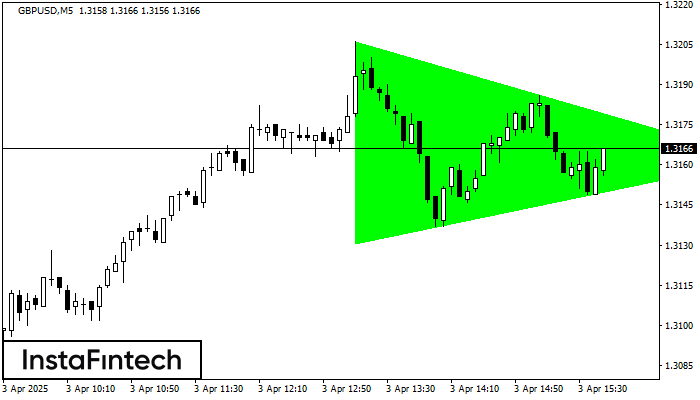
According to the chart of M5, GBPUSD formed the Bullish Symmetrical Triangle pattern. Description: This is the pattern of a trend continuation. 1.3206 and 1.3131 are the coordinates of the upper and lower borders respectively. The pattern width is measured on the chart at 75 pips. Outlook: If the upper border 1.3206 is broken, the price is likely to continue its move by 1.3177.
The M5 and M15 time frames may have more false entry points.
Veja também
- All
- All
- Bearish Rectangle
- Bearish Symmetrical Triangle
- Bearish Symmetrical Triangle
- Bullish Rectangle
- Double Top
- Double Top
- Triple Bottom
- Triple Bottom
- Triple Top
- Triple Top
- All
- All
- Buy
- Sale
- All
- 1
- 2
- 3
- 4
- 5
Retângulo de alta
was formed on 12.05 at 14:12:31 (UTC+0)
signal strength 1 of 5
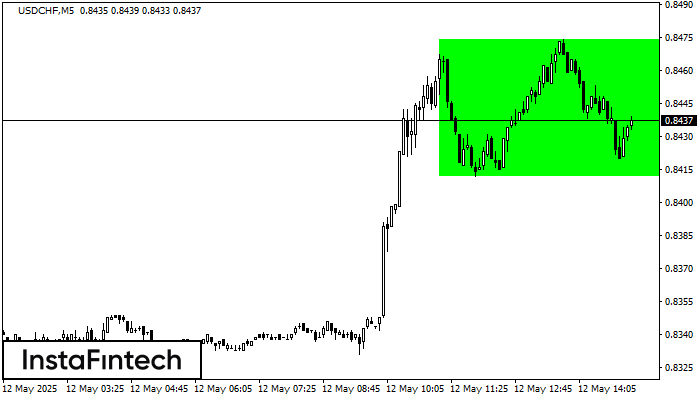
De acordo com o gráfico de M5, USDCHF formou Retângulo de alta. O padrão indica uma continuação da tendência. O limite superior é 0.8474, o limite inferior é 0.8412
Os intervalos M5 e M15 podem ter mais pontos de entrada falsos.
Open chart in a new window
Retângulo de baixa
was formed on 12.05 at 14:12:00 (UTC+0)
signal strength 1 of 5
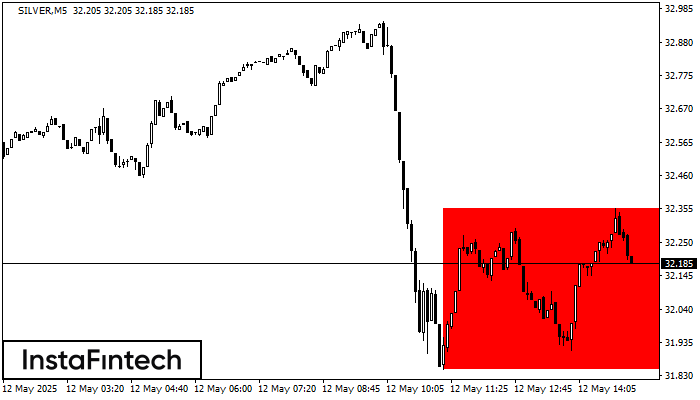
De acordo com o gráfico de M5, SILVER formou Retângulo de baixa. O padrão indica uma continuação da tendência. O limite superior é 32.35, o limite inferior é 31.85
Os intervalos M5 e M15 podem ter mais pontos de entrada falsos.
Open chart in a new window
Topo triplo
was formed on 12.05 at 12:55:23 (UTC+0)
signal strength 1 of 5
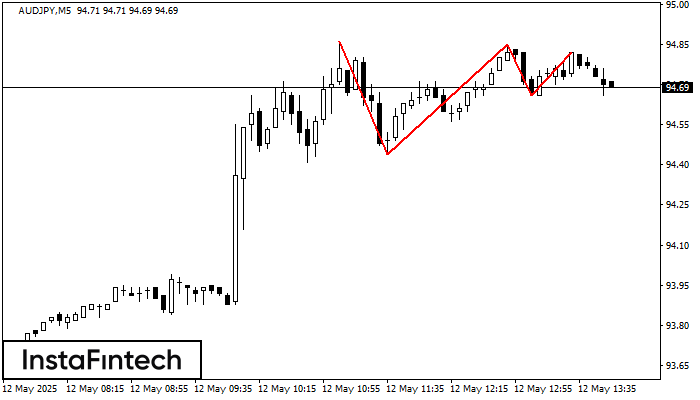
No gráfico do instrumento de negociação AUDJPY M5, o padrão Topo triplo que sinaliza uma mudança de tendência se formou. É possível que após a formação do terceiro pico
Os intervalos M5 e M15 podem ter mais pontos de entrada falsos.
Open chart in a new window


