

Padrões atuais

Padrões são modelos gráficos que são formados no gráfico pelo preço. Segundo um dos postulados da análise técnica, a história (movimento de preços) se repete. Isso significa que os movimentos de preços geralmente são semelhantes nas mesmas situações, o que possibilita prever o desenvolvimento futuro da situação com alta probabilidade.
Os padrões relevantes da InstaTrade são um serviço fácil de usar, que permite que você esteja ciente das últimas mudanças no mercado e reaja a indícios do mercado a tempo. Em nosso serviço, você sempre encontrará os padrões mais recentes e relevantes em qualquer par e em qualquer período gráfico.
Triple Bottom
was formed on 02.04 at 13:40:27 (UTC+0)
signal strength 1 of 5
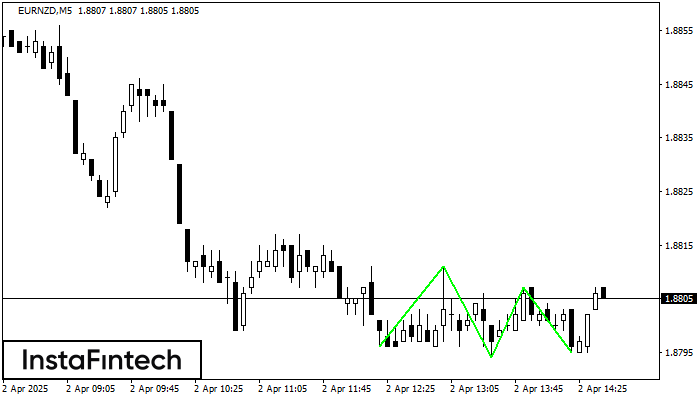
The Triple Bottom pattern has formed on the chart of EURNZD M5. Features of the pattern: The lower line of the pattern has coordinates 1.8811 with the upper limit 1.8811/1.8807, the projection of the width is 15 points. The formation of the Triple Bottom pattern most likely indicates a change in the trend from downward to upward. This means that in the event of a breakdown of the resistance level 1.8796, the price is most likely to continue the upward movement.
The M5 and M15 time frames may have more false entry points.
- All
- All
- Bearish Rectangle
- Bearish Symmetrical Triangle
- Bearish Symmetrical Triangle
- Bullish Rectangle
- Double Top
- Double Top
- Triple Bottom
- Triple Bottom
- Triple Top
- Triple Top
- All
- All
- Buy
- Sale
- All
- 1
- 2
- 3
- 4
- 5
Topo duplo
was formed on 22.05 at 23:00:29 (UTC+0)
signal strength 4 of 5
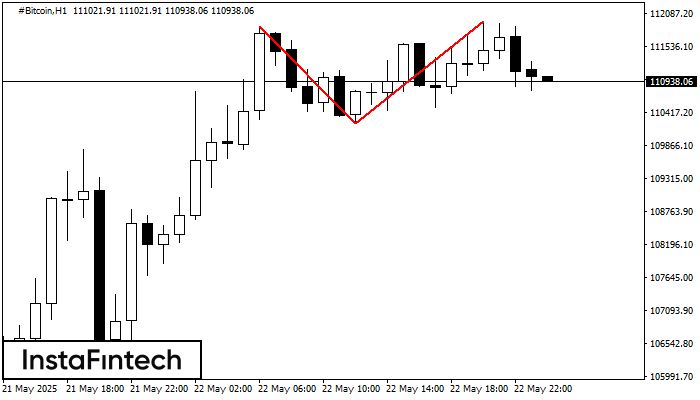
No gráfico de #Bitcoin H1 o padrão de reversão Topo duplo foi formado. Características: o limite superior 111951.72; o limite inferior 110239.46; a largura do padrão 171226 pontos. O sinal
Open chart in a new window
Triângulo Simétrico de Baixa
was formed on 22.05 at 22:01:48 (UTC+0)
signal strength 3 of 5
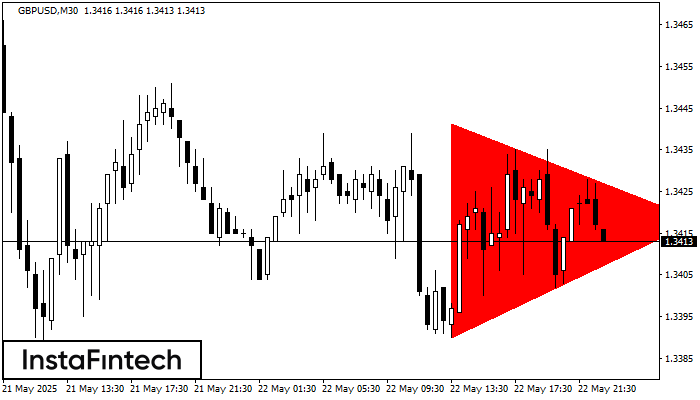
De acordo com o gráfico de M30, GBPUSD fomrou o padrão de Triângulo Simétrico de Baixa. Este padrão sinaliza uma nova tendência de baixa se o limite inferior 1.3390
Open chart in a new window
Triângulo Simétrico de Baixa
was formed on 22.05 at 22:01:15 (UTC+0)
signal strength 2 of 5
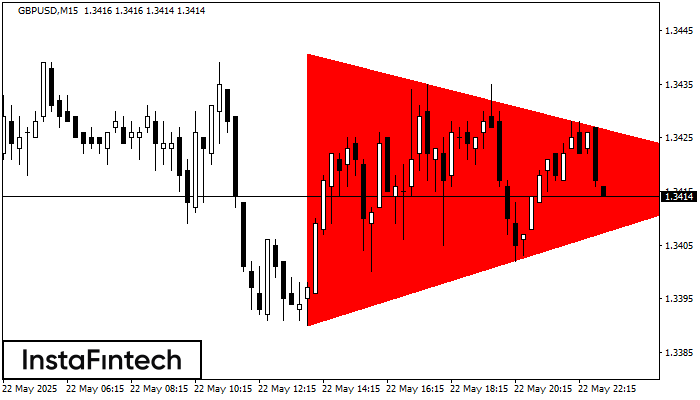
De acordo com o gráfico de M15, GBPUSD fomrou o padrão de Triângulo Simétrico de Baixa. Este padrão sinaliza uma nova tendência de baixa se o limite inferior 1.3390
Os intervalos M5 e M15 podem ter mais pontos de entrada falsos.
Open chart in a new window


