

Padrões atuais

Padrões são modelos gráficos que são formados no gráfico pelo preço. Segundo um dos postulados da análise técnica, a história (movimento de preços) se repete. Isso significa que os movimentos de preços geralmente são semelhantes nas mesmas situações, o que possibilita prever o desenvolvimento futuro da situação com alta probabilidade.
Os padrões relevantes da InstaTrade são um serviço fácil de usar, que permite que você esteja ciente das últimas mudanças no mercado e reaja a indícios do mercado a tempo. Em nosso serviço, você sempre encontrará os padrões mais recentes e relevantes em qualquer par e em qualquer período gráfico.
Double Bottom
was formed on 02.04 at 11:00:06 (UTC+0)
signal strength 4 of 5
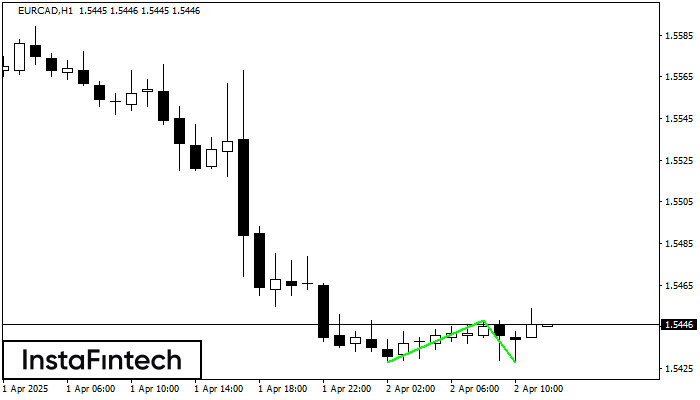
The Double Bottom pattern has been formed on EURCAD H1; the upper boundary is 1.5448; the lower boundary is 1.5428. The width of the pattern is 20 points. In case of a break of the upper boundary 1.5448, a change in the trend can be predicted where the width of the pattern will coincide with the distance to a possible take profit level.
Veja também
- All
- All
- Bearish Rectangle
- Bearish Symmetrical Triangle
- Bearish Symmetrical Triangle
- Bullish Rectangle
- Double Top
- Double Top
- Triple Bottom
- Triple Bottom
- Triple Top
- Triple Top
- All
- All
- Buy
- Sale
- All
- 1
- 2
- 3
- 4
- 5
Bullish Rectangle
was formed on 09.06 at 02:52:42 (UTC+0)
signal strength 2 of 5
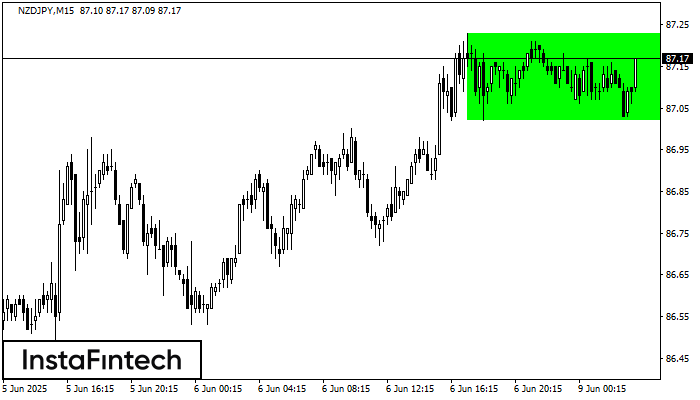
According to the chart of M15, NZDJPY formed the Bullish Rectangle. The pattern indicates a trend continuation. The upper border is 87.23, the lower border is 87.02. The signal means
The M5 and M15 time frames may have more false entry points.
Open chart in a new window
Bullish Rectangle
was formed on 09.06 at 02:52:32 (UTC+0)
signal strength 3 of 5
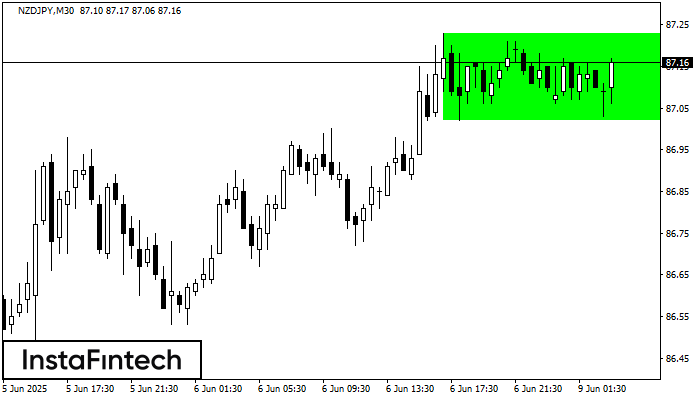
According to the chart of M30, NZDJPY formed the Bullish Rectangle which is a pattern of a trend continuation. The pattern is contained within the following borders: the lower border
Open chart in a new window
Bullish Symmetrical Triangle
was formed on 09.06 at 02:47:22 (UTC+0)
signal strength 4 of 5
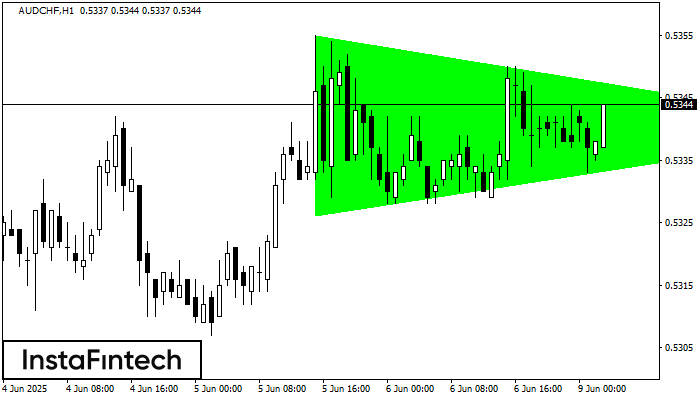
According to the chart of H1, AUDCHF formed the Bullish Symmetrical Triangle pattern, which signals the trend will continue. Description. The upper border of the pattern touches the coordinates 0.5355/0.5340
Open chart in a new window


