

Padrões atuais

Padrões são modelos gráficos que são formados no gráfico pelo preço. Segundo um dos postulados da análise técnica, a história (movimento de preços) se repete. Isso significa que os movimentos de preços geralmente são semelhantes nas mesmas situações, o que possibilita prever o desenvolvimento futuro da situação com alta probabilidade.
Os padrões relevantes da InstaTrade são um serviço fácil de usar, que permite que você esteja ciente das últimas mudanças no mercado e reaja a indícios do mercado a tempo. Em nosso serviço, você sempre encontrará os padrões mais recentes e relevantes em qualquer par e em qualquer período gráfico.
Bullish Rectangle
was formed on 02.04 at 04:46:22 (UTC+0)
signal strength 1 of 5
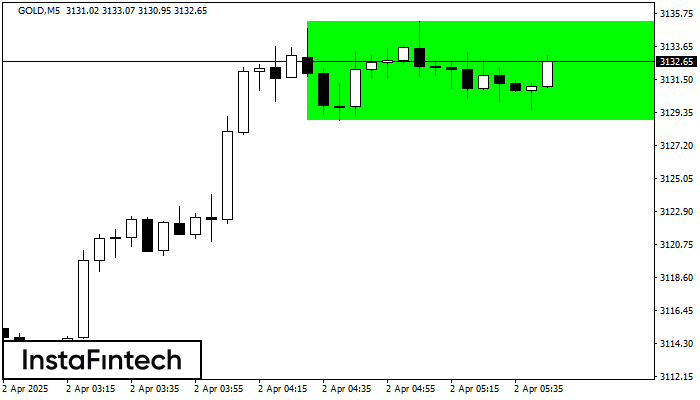
According to the chart of M5, GOLD formed the Bullish Rectangle which is a pattern of a trend continuation. The pattern is contained within the following borders: the lower border 3128.79 – 3128.79 and upper border 3135.25 – 3135.25. In case the upper border is broken, the instrument is likely to follow the upward trend.
The M5 and M15 time frames may have more false entry points.
- All
- All
- Bearish Rectangle
- Bearish Symmetrical Triangle
- Bearish Symmetrical Triangle
- Bullish Rectangle
- Double Top
- Double Top
- Triple Bottom
- Triple Bottom
- Triple Top
- Triple Top
- All
- All
- Buy
- Sale
- All
- 1
- 2
- 3
- 4
- 5
Fundo duplo
was formed on 29.05 at 10:20:05 (UTC+0)
signal strength 1 of 5
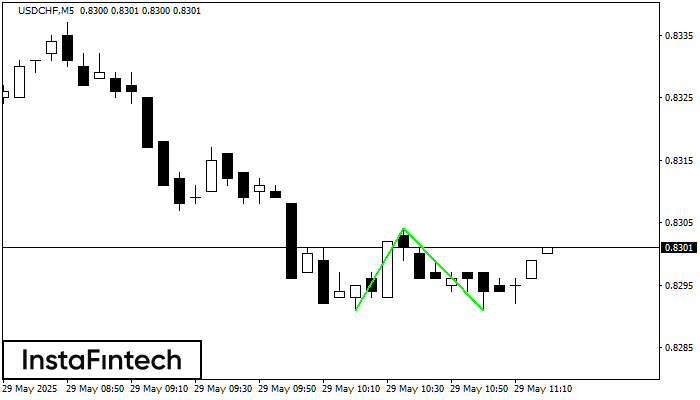
O padrão Fundo duplo foi formado em USDCHF M5; o limite superior é 0.8304; o limite inferior é 0.8291. A largura do padrão é de 13 pontos. No caso
Os intervalos M5 e M15 podem ter mais pontos de entrada falsos.
Open chart in a new window
Cabeça & Ombros
was formed on 29.05 at 09:45:24 (UTC+0)
signal strength 1 of 5
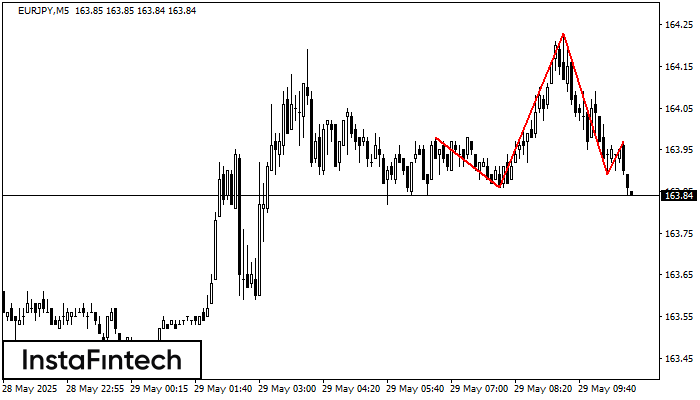
De acordo com o gráfico de M5, EURJPY formou o padrão Cabeça & Ombros. O topo da Cabeça está definido em 164.23 enquanto a linha mediana do Pescoço é encontrada
Os intervalos M5 e M15 podem ter mais pontos de entrada falsos.
Open chart in a new window
Topo duplo
was formed on 29.05 at 09:30:03 (UTC+0)
signal strength 3 of 5
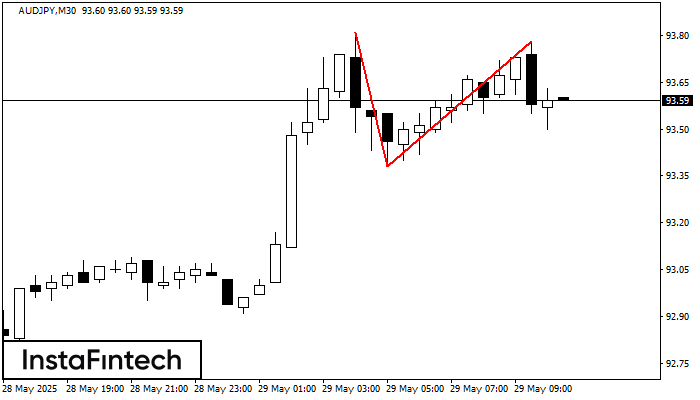
O padrão Topo duplo foi formado em AUDJPY M30. Isso sinaliza que a tendência foi alterada de cima para baixo. Provavelmente, se a base do padrão 93.38 for quebrada
Open chart in a new window


