

Padrões atuais

Padrões são modelos gráficos que são formados no gráfico pelo preço. Segundo um dos postulados da análise técnica, a história (movimento de preços) se repete. Isso significa que os movimentos de preços geralmente são semelhantes nas mesmas situações, o que possibilita prever o desenvolvimento futuro da situação com alta probabilidade.
Os padrões relevantes da InstaTrade são um serviço fácil de usar, que permite que você esteja ciente das últimas mudanças no mercado e reaja a indícios do mercado a tempo. Em nosso serviço, você sempre encontrará os padrões mais recentes e relevantes em qualquer par e em qualquer período gráfico.
Inverse Head and Shoulder
was formed on 01.04 at 20:15:50 (UTC+0)
signal strength 2 of 5
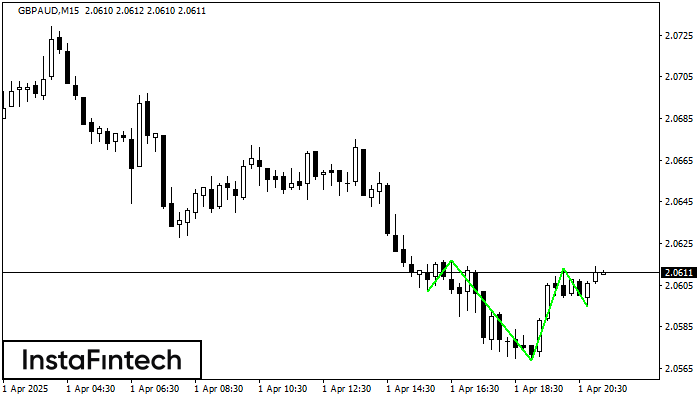
According to the chart of M15, GBPAUD formed the Inverse Head and Shoulder pattern. The Head’s top is set at 2.0613 while the median line of the Neck is found at 2.0569/2.0595. The formation of the Inverse Head and Shoulder pattern evidently signals a reversal of the downward trend. In other words, in case the scenario comes true, the price of GBPAUD will go towards 2.0635
The M5 and M15 time frames may have more false entry points.
- All
- All
- Bearish Rectangle
- Bearish Symmetrical Triangle
- Bearish Symmetrical Triangle
- Bullish Rectangle
- Double Top
- Double Top
- Triple Bottom
- Triple Bottom
- Triple Top
- Triple Top
- All
- All
- Buy
- Sale
- All
- 1
- 2
- 3
- 4
- 5
Двойное дно
сформирован 29.05 в 05:19:51 (UTC+0)
сила сигнала 1 из 5
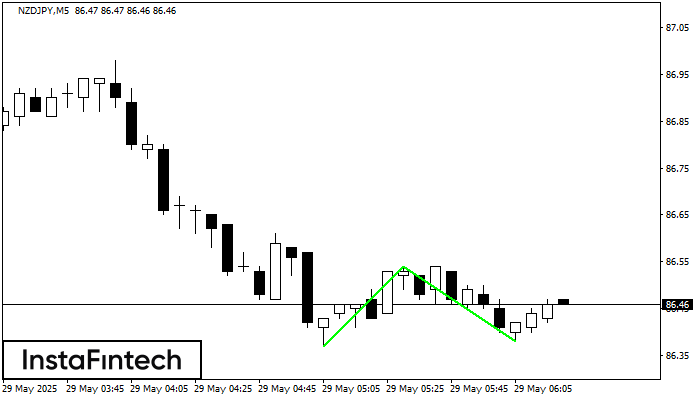
Сформирована фигура «Двойное дно» на графике NZDJPY M5. Характеристика: Уровень поддержки 86.37; Уровень сопротивления 86.54; Ширина фигуры 17 пунктов. В случае пробоя уровня сопротивления можно будет прогнозировать изменение тенденции
Таймфреймы М5 и М15 могут иметь больше ложных точек входа.
Открыть график инструмента в новом окне
Двойная вершина
сформирован 29.05 в 03:41:06 (UTC+0)
сила сигнала 1 из 5
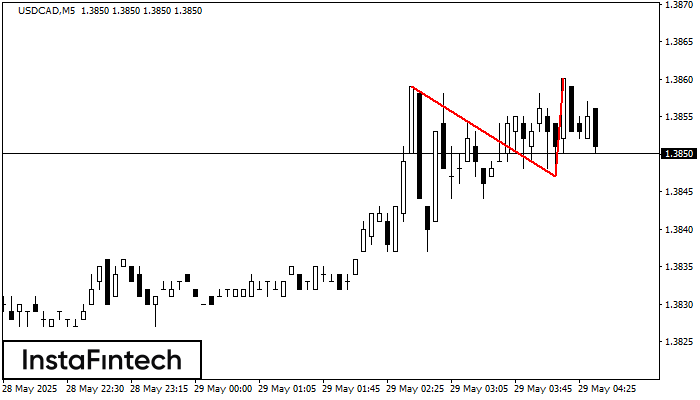
По USDCAD на M5 сформировалась разворотная фигура «Двойная вершина». Характеристика: Верхняя граница 1.3859; Нижняя граница 1.3847; Ширина фигуры 13 пунктов. Позицию на продажу возможно открыть ниже нижней границы 1.3847
Таймфреймы М5 и М15 могут иметь больше ложных точек входа.
Открыть график инструмента в новом окне
Двойная вершина
сформирован 29.05 в 03:20:04 (UTC+0)
сила сигнала 1 из 5
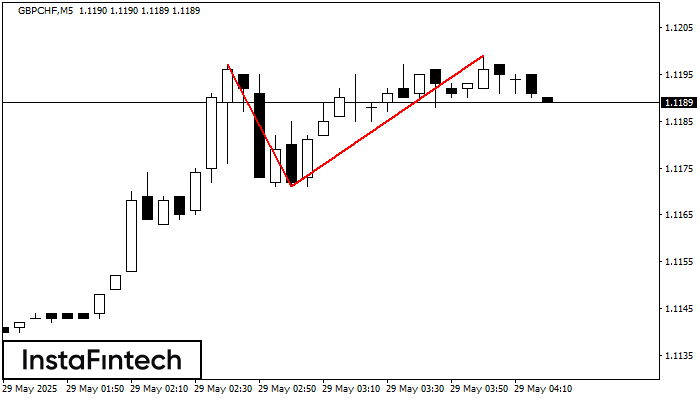
По торговому инструменту GBPCHF на M5 сформировалась фигура «Двойная вершина», которая сигнализирует нам об изменении тенденции с восходящей на нисходящую. Вероятно, что, в случае пробоя основания фигуры 1.1171, возможно дальнейшее
Таймфреймы М5 и М15 могут иметь больше ложных точек входа.
Открыть график инструмента в новом окне


