

Padrões atuais

Padrões são modelos gráficos que são formados no gráfico pelo preço. Segundo um dos postulados da análise técnica, a história (movimento de preços) se repete. Isso significa que os movimentos de preços geralmente são semelhantes nas mesmas situações, o que possibilita prever o desenvolvimento futuro da situação com alta probabilidade.
Os padrões relevantes da InstaTrade são um serviço fácil de usar, que permite que você esteja ciente das últimas mudanças no mercado e reaja a indícios do mercado a tempo. Em nosso serviço, você sempre encontrará os padrões mais recentes e relevantes em qualquer par e em qualquer período gráfico.
Bullish Rectangle
was formed on 31.03 at 14:32:37 (UTC+0)
signal strength 1 of 5

According to the chart of M5, #Bitcoin formed the Bullish Rectangle which is a pattern of a trend continuation. The pattern is contained within the following borders: the lower border 81857.61 – 81857.61 and upper border 82250.14 – 82250.14. In case the upper border is broken, the instrument is likely to follow the upward trend.
The M5 and M15 time frames may have more false entry points.
Veja também
- All
- All
- Bearish Rectangle
- Bearish Symmetrical Triangle
- Bearish Symmetrical Triangle
- Bullish Rectangle
- Double Top
- Double Top
- Triple Bottom
- Triple Bottom
- Triple Top
- Triple Top
- All
- All
- Buy
- Sale
- All
- 1
- 2
- 3
- 4
- 5
Triple Bottom
was formed on 02.06 at 05:50:03 (UTC+0)
signal strength 1 of 5
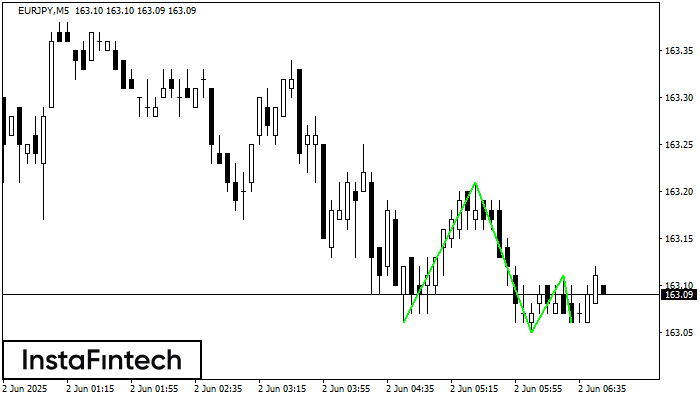
The Triple Bottom pattern has been formed on EURJPY M5. It has the following characteristics: resistance level 163.21/163.11; support level 163.06/163.06; the width is 15 points. In the event
The M5 and M15 time frames may have more false entry points.
Open chart in a new window
Double Bottom
was formed on 02.06 at 05:25:31 (UTC+0)
signal strength 1 of 5
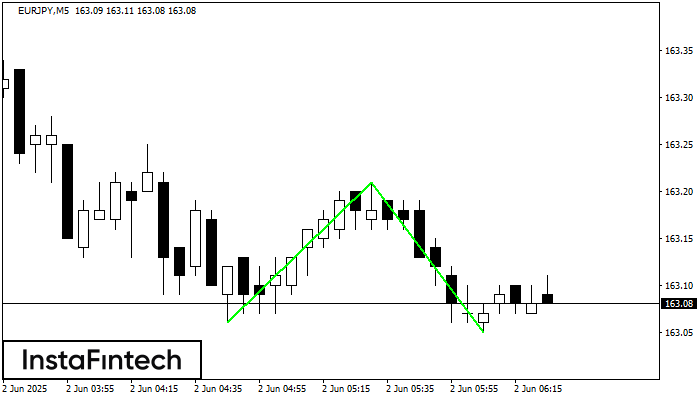
The Double Bottom pattern has been formed on EURJPY M5; the upper boundary is 163.21; the lower boundary is 163.05. The width of the pattern is 15 points. In case
The M5 and M15 time frames may have more false entry points.
Open chart in a new window
Bullish Symmetrical Triangle
was formed on 02.06 at 05:21:10 (UTC+0)
signal strength 1 of 5
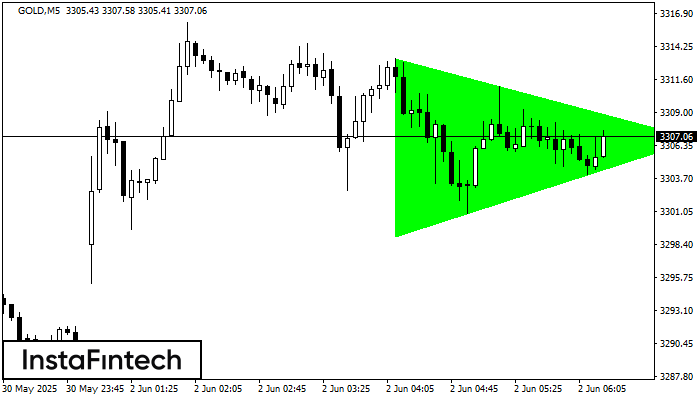
According to the chart of M5, GOLD formed the Bullish Symmetrical Triangle pattern, which signals the trend will continue. Description. The upper border of the pattern touches the coordinates 3313.29/3306.86
The M5 and M15 time frames may have more false entry points.
Open chart in a new window


