

Padrões atuais

Padrões são modelos gráficos que são formados no gráfico pelo preço. Segundo um dos postulados da análise técnica, a história (movimento de preços) se repete. Isso significa que os movimentos de preços geralmente são semelhantes nas mesmas situações, o que possibilita prever o desenvolvimento futuro da situação com alta probabilidade.
Os padrões relevantes da InstaTrade são um serviço fácil de usar, que permite que você esteja ciente das últimas mudanças no mercado e reaja a indícios do mercado a tempo. Em nosso serviço, você sempre encontrará os padrões mais recentes e relevantes em qualquer par e em qualquer período gráfico.
Double Bottom
was formed on 31.03 at 13:30:19 (UTC+0)
signal strength 3 of 5
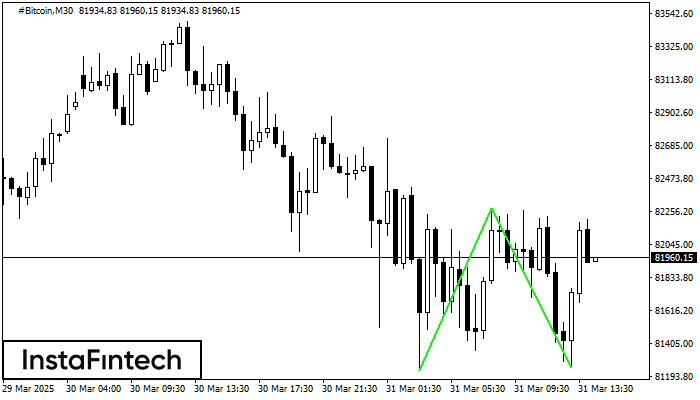
The Double Bottom pattern has been formed on #Bitcoin M30. This formation signals a reversal of the trend from downwards to upwards. The signal is that a buy trade should be opened after the upper boundary of the pattern 82275.64 is broken. The further movements will rely on the width of the current pattern 104454 points.
- All
- All
- Bearish Rectangle
- Bearish Symmetrical Triangle
- Bearish Symmetrical Triangle
- Bullish Rectangle
- Double Top
- Double Top
- Triple Bottom
- Triple Bottom
- Triple Top
- Triple Top
- All
- All
- Buy
- Sale
- All
- 1
- 2
- 3
- 4
- 5
Fundo duplo
was formed on 14.06 at 21:00:24 (UTC+0)
signal strength 1 of 5
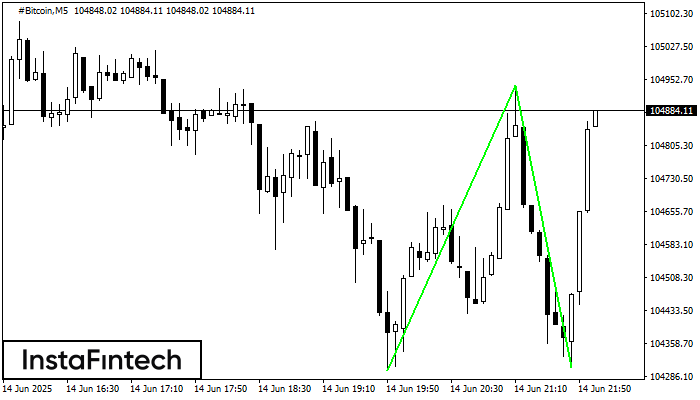
O padrão Fundo duplo foi formado em #Bitcoin M5. Características: o nível de suporte 104299.16; o nível de resistência 104939.96; a largura do padrão 64080 pontos. Se o nível
Os intervalos M5 e M15 podem ter mais pontos de entrada falsos.
Open chart in a new window
Fundo duplo
was formed on 14.06 at 15:14:48 (UTC+0)
signal strength 2 of 5

O padrão Fundo duplo foi formado em #Bitcoin M15. Características: o nível de suporte 104607.76; o nível de resistência 106173.71; a largura do padrão 156595 pontos. Se o nível
Os intervalos M5 e M15 podem ter mais pontos de entrada falsos.
Open chart in a new window
Fundo triplo
was formed on 13.06 at 22:45:28 (UTC+0)
signal strength 1 of 5

O padrão Fundo triplo foi formado no gráfico de AUDCHF M5. Características do padrão: A linha inferior do padrão tem coordenadas 0.5269 com o limite superior 0.5269/0.5268, a projeção
Os intervalos M5 e M15 podem ter mais pontos de entrada falsos.
Open chart in a new window


