

Padrões atuais

Padrões são modelos gráficos que são formados no gráfico pelo preço. Segundo um dos postulados da análise técnica, a história (movimento de preços) se repete. Isso significa que os movimentos de preços geralmente são semelhantes nas mesmas situações, o que possibilita prever o desenvolvimento futuro da situação com alta probabilidade.
Os padrões relevantes da InstaTrade são um serviço fácil de usar, que permite que você esteja ciente das últimas mudanças no mercado e reaja a indícios do mercado a tempo. Em nosso serviço, você sempre encontrará os padrões mais recentes e relevantes em qualquer par e em qualquer período gráfico.
Double Bottom
was formed on 30.03 at 23:00:31 (UTC+0)
signal strength 3 of 5
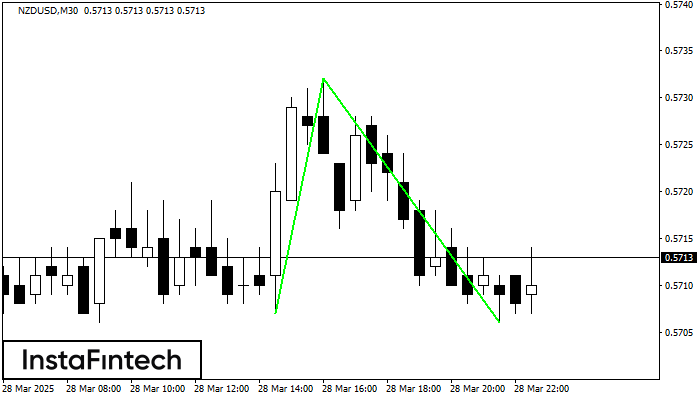
The Double Bottom pattern has been formed on NZDUSD M30. This formation signals a reversal of the trend from downwards to upwards. The signal is that a buy trade should be opened after the upper boundary of the pattern 0.5732 is broken. The further movements will rely on the width of the current pattern 25 points.
Veja também
- All
- All
- Bearish Rectangle
- Bearish Symmetrical Triangle
- Bearish Symmetrical Triangle
- Bullish Rectangle
- Double Top
- Double Top
- Triple Bottom
- Triple Bottom
- Triple Top
- Triple Top
- All
- All
- Buy
- Sale
- All
- 1
- 2
- 3
- 4
- 5
Topo triplo
was formed on 28.05 at 16:45:20 (UTC+0)
signal strength 1 of 5
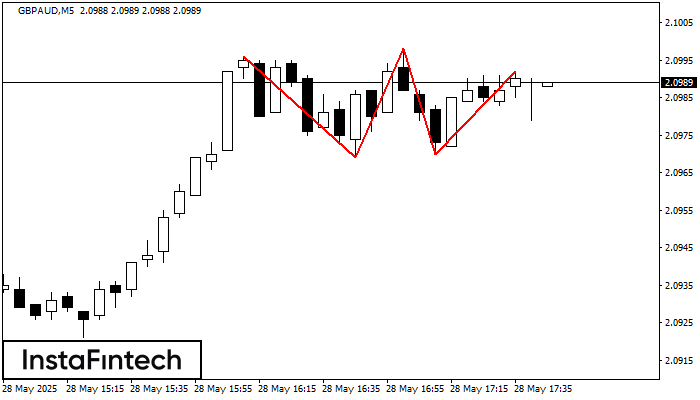
O padrão Topo triplo foi formado no gráfico do instrumento de negociação GBPAUD M5. É um padrão de reversão com as seguintes características: nível de resistência 4, nível de suporte
Os intervalos M5 e M15 podem ter mais pontos de entrada falsos.
Open chart in a new window
Topo triplo
was formed on 28.05 at 16:30:35 (UTC+0)
signal strength 3 of 5
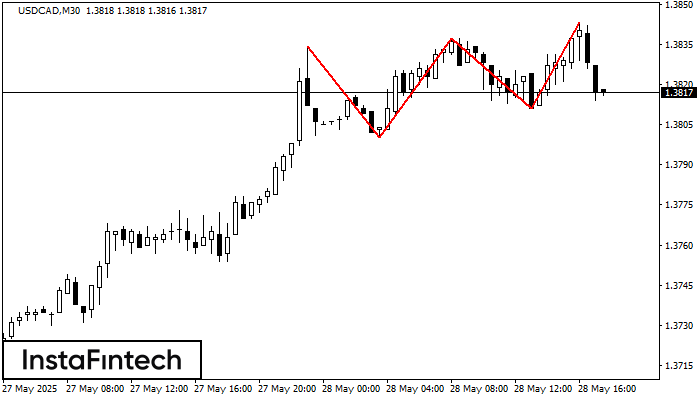
O padrão Topo triplo se formou no gráfico de USDCAD M30. Características do padrão: os limites têm um ângulo ascendente; a linha inferior do padrão tem as coordenadas 1.3800/1.3811
Open chart in a new window
Retângulo de alta
was formed on 28.05 at 16:27:21 (UTC+0)
signal strength 1 of 5
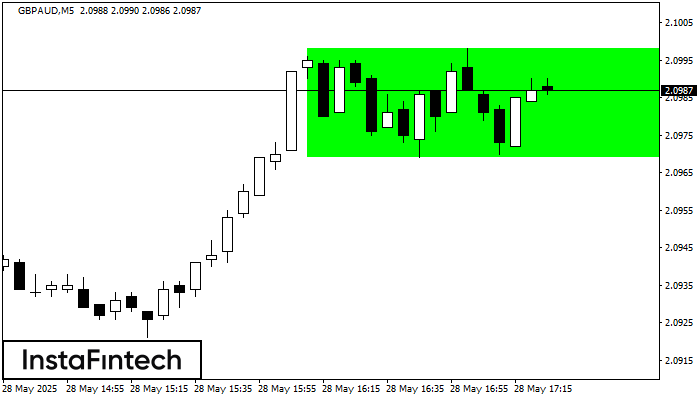
De acordo com o gráfico de M5, GBPAUD formou o Retângulo de alta que é um padrão de uma continuação da tendência. O padrão está dentro dos seguintes limites
Os intervalos M5 e M15 podem ter mais pontos de entrada falsos.
Open chart in a new window


