

Padrões atuais

Padrões são modelos gráficos que são formados no gráfico pelo preço. Segundo um dos postulados da análise técnica, a história (movimento de preços) se repete. Isso significa que os movimentos de preços geralmente são semelhantes nas mesmas situações, o que possibilita prever o desenvolvimento futuro da situação com alta probabilidade.
Os padrões relevantes da InstaTrade são um serviço fácil de usar, que permite que você esteja ciente das últimas mudanças no mercado e reaja a indícios do mercado a tempo. Em nosso serviço, você sempre encontrará os padrões mais recentes e relevantes em qualquer par e em qualquer período gráfico.
Bearish Rectangle
was formed on 28.03 at 07:51:40 (UTC+0)
signal strength 1 of 5
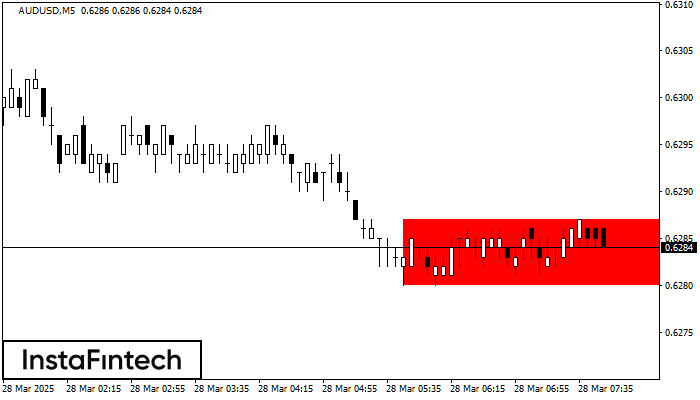
According to the chart of M5, AUDUSD formed the Bearish Rectangle which is a pattern of a trend continuation. The pattern is contained within the following borders: lower border 0.6280 – 0.6280 and upper border 0.6287 – 0.6287. In case the lower border is broken, the instrument is likely to follow the downward trend.
The M5 and M15 time frames may have more false entry points.
Veja também
- All
- All
- Bearish Rectangle
- Bearish Symmetrical Triangle
- Bearish Symmetrical Triangle
- Bullish Rectangle
- Double Top
- Double Top
- Triple Bottom
- Triple Bottom
- Triple Top
- Triple Top
- All
- All
- Buy
- Sale
- All
- 1
- 2
- 3
- 4
- 5
Bullish Flag
was formed on 10.06 at 03:37:39 (UTC+0)
signal strength 1 of 5

The Bullish Flag pattern has been formed on AUDJPY at M5. The lower boundary of the pattern is located at 94.27/94.19, while the higher boundary lies at 94.35/94.27. The projection
The M5 and M15 time frames may have more false entry points.
Open chart in a new window
Bullish pennant
was formed on 10.06 at 03:37:33 (UTC+0)
signal strength 1 of 5
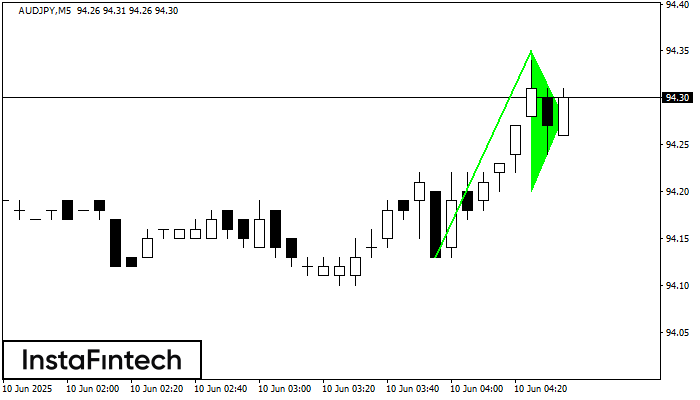
The Bullish pennant signal – Trading instrument AUDJPY M5, continuation pattern. Forecast: it is possible to set up a buy position above the pattern’s high of 94.35, with the prospect
The M5 and M15 time frames may have more false entry points.
Open chart in a new window
Bullish Symmetrical Triangle
was formed on 10.06 at 02:30:27 (UTC+0)
signal strength 3 of 5
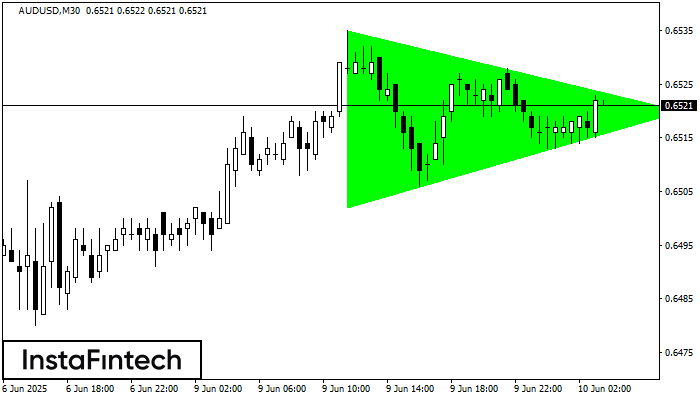
According to the chart of M30, AUDUSD formed the Bullish Symmetrical Triangle pattern. Description: This is the pattern of a trend continuation. 0.6535 and 0.6502 are the coordinates
Open chart in a new window


