

Padrões atuais

Padrões são modelos gráficos que são formados no gráfico pelo preço. Segundo um dos postulados da análise técnica, a história (movimento de preços) se repete. Isso significa que os movimentos de preços geralmente são semelhantes nas mesmas situações, o que possibilita prever o desenvolvimento futuro da situação com alta probabilidade.
Os padrões relevantes da InstaTrade são um serviço fácil de usar, que permite que você esteja ciente das últimas mudanças no mercado e reaja a indícios do mercado a tempo. Em nosso serviço, você sempre encontrará os padrões mais recentes e relevantes em qualquer par e em qualquer período gráfico.
Bearish Rectangle
was formed on 27.03 at 06:07:54 (UTC+0)
signal strength 1 of 5

According to the chart of M5, USDJPY formed the Bearish Rectangle. The pattern indicates a trend continuation. The upper border is 150.29, the lower border is 150.10. The signal means that a short position should be opened after fixing a price below the lower border 150.10 of the Bearish Rectangle.
The M5 and M15 time frames may have more false entry points.
Veja também
- All
- All
- Bearish Rectangle
- Bearish Symmetrical Triangle
- Bearish Symmetrical Triangle
- Bullish Rectangle
- Double Top
- Double Top
- Triple Bottom
- Triple Bottom
- Triple Top
- Triple Top
- All
- All
- Buy
- Sale
- All
- 1
- 2
- 3
- 4
- 5
Topo triplo
was formed on 09.06 at 12:50:42 (UTC+0)
signal strength 1 of 5
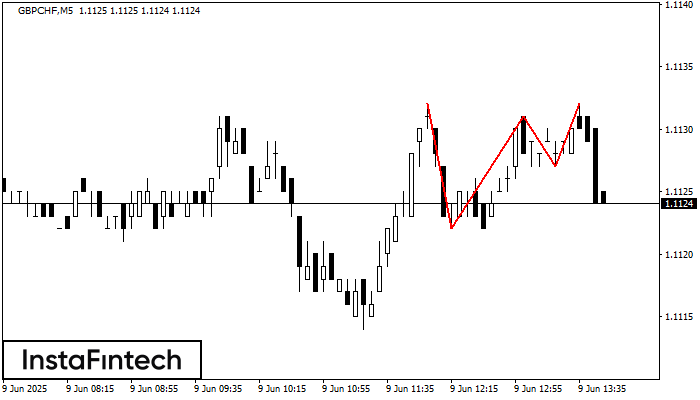
O padrão Topo triplo se formou no gráfico de GBPCHF M5. Características do padrão: os limites têm um ângulo ascendente; a linha inferior do padrão tem as coordenadas 1.1122/1.1127
Os intervalos M5 e M15 podem ter mais pontos de entrada falsos.
Open chart in a new window
Fundo duplo
was formed on 09.06 at 12:50:36 (UTC+0)
signal strength 1 of 5
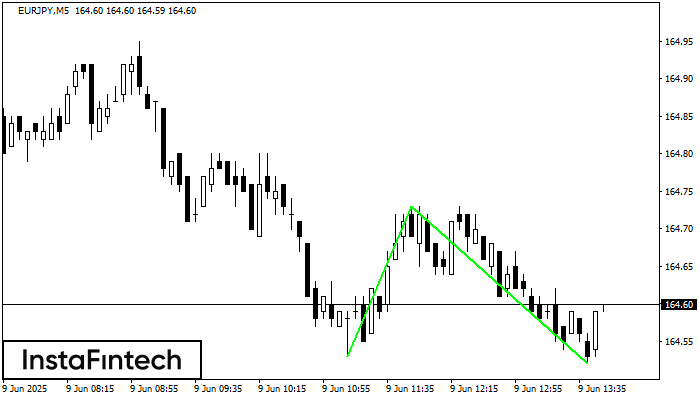
O padrão Fundo duplo foi formado em EURJPY M5. Esta formação sinaliza uma reversão da tendência de baixo para cima. O sinal é que uma negociação de compra deve
Os intervalos M5 e M15 podem ter mais pontos de entrada falsos.
Open chart in a new window
Fundo triplo
was formed on 09.06 at 12:40:25 (UTC+0)
signal strength 1 of 5
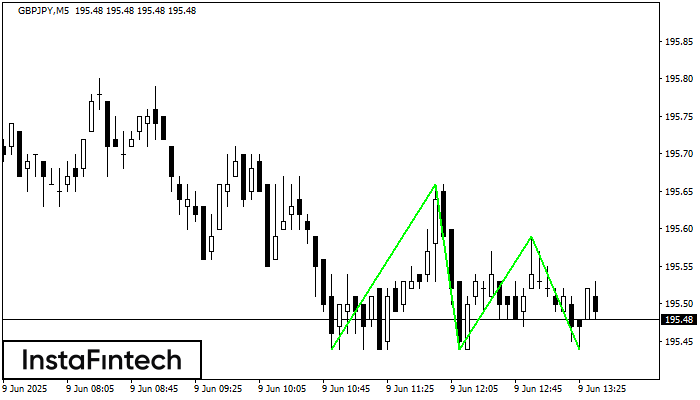
O padrão Fundo triplo foi formado no gráfico de GBPJPY M5. Características do padrão: A linha inferior do padrão tem coordenadas 195.66 com o limite superior 195.66/195.59, a projeção
Os intervalos M5 e M15 podem ter mais pontos de entrada falsos.
Open chart in a new window


