

Padrões atuais

Padrões são modelos gráficos que são formados no gráfico pelo preço. Segundo um dos postulados da análise técnica, a história (movimento de preços) se repete. Isso significa que os movimentos de preços geralmente são semelhantes nas mesmas situações, o que possibilita prever o desenvolvimento futuro da situação com alta probabilidade.
Os padrões relevantes da InstaTrade são um serviço fácil de usar, que permite que você esteja ciente das últimas mudanças no mercado e reaja a indícios do mercado a tempo. Em nosso serviço, você sempre encontrará os padrões mais recentes e relevantes em qualquer par e em qualquer período gráfico.
Bearish Symmetrical Triangle
was formed on 26.03 at 23:42:58 (UTC+0)
signal strength 1 of 5
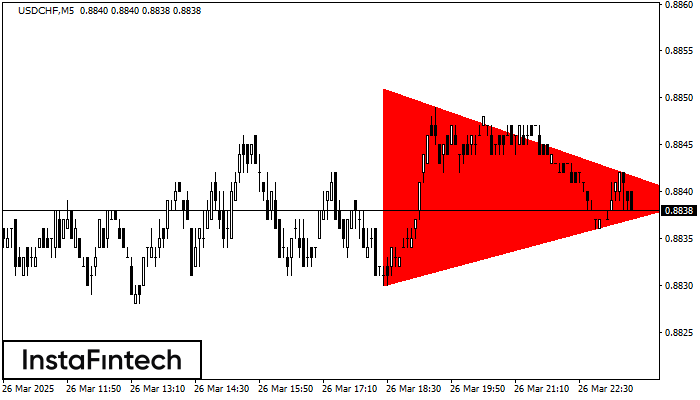
According to the chart of M5, USDCHF formed the Bearish Symmetrical Triangle pattern. This pattern signals a further downward trend in case the lower border 0.8830 is breached. Here, a hypothetical profit will equal the width of the available pattern that is -21 pips.
The M5 and M15 time frames may have more false entry points.
- All
- All
- Bearish Rectangle
- Bearish Symmetrical Triangle
- Bearish Symmetrical Triangle
- Bullish Rectangle
- Double Top
- Double Top
- Triple Bottom
- Triple Bottom
- Triple Top
- Triple Top
- All
- All
- Buy
- Sale
- All
- 1
- 2
- 3
- 4
- 5
Fundo triplo
was formed on 10.06 at 09:55:51 (UTC+0)
signal strength 1 of 5
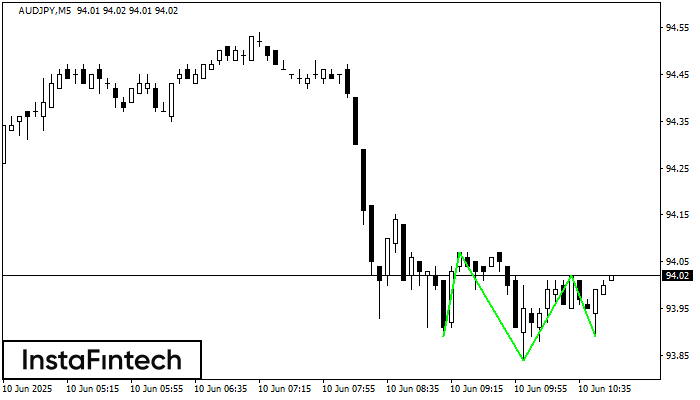
O padrão Fundo triplo foi formado em AUDJPY M5. Possui as seguintes características: nível de resistência 94.07/94.02; nível de suporte 93.89/93.89; a largura é de 18 pontos. Se houver
Os intervalos M5 e M15 podem ter mais pontos de entrada falsos.
Open chart in a new window
Cabeça & Ombro Invertidos
was formed on 10.06 at 09:44:57 (UTC+0)
signal strength 2 of 5
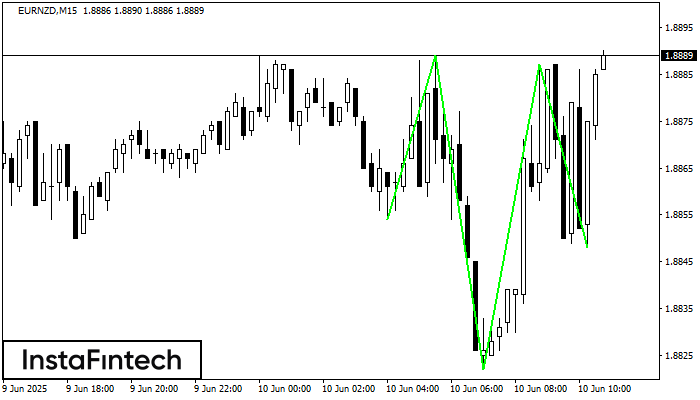
De acordo com M15, EURNZD está moldando o padrão técnico – os Cabeça & Ombro Invertidos. Caso a linha de pescoço 1.8889/1.8887 seja quebrada, o instrumento provavelmente se moverá para
Os intervalos M5 e M15 podem ter mais pontos de entrada falsos.
Open chart in a new window
Retângulo de baixa
was formed on 10.06 at 09:42:43 (UTC+0)
signal strength 1 of 5
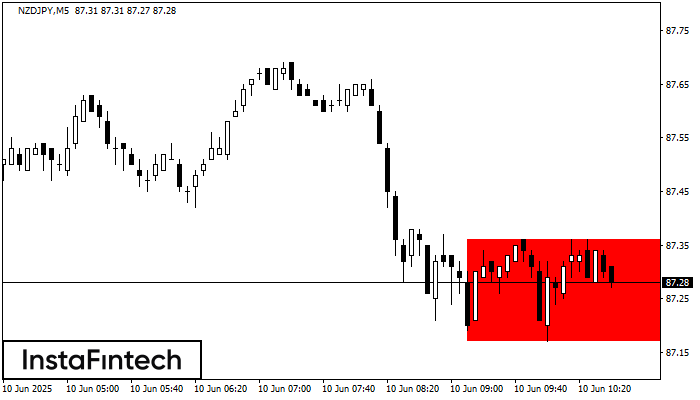
De acordo com o gráfico de M5, NZDJPY formou Retângulo de baixa. Este tipo de padrão indica uma continuação da tendência. Ele consiste em dois níveis: resistência 87.36 – 0.00
Os intervalos M5 e M15 podem ter mais pontos de entrada falsos.
Open chart in a new window


