

Padrões atuais

Padrões são modelos gráficos que são formados no gráfico pelo preço. Segundo um dos postulados da análise técnica, a história (movimento de preços) se repete. Isso significa que os movimentos de preços geralmente são semelhantes nas mesmas situações, o que possibilita prever o desenvolvimento futuro da situação com alta probabilidade.
Os padrões relevantes da InstaTrade são um serviço fácil de usar, que permite que você esteja ciente das últimas mudanças no mercado e reaja a indícios do mercado a tempo. Em nosso serviço, você sempre encontrará os padrões mais recentes e relevantes em qualquer par e em qualquer período gráfico.
Triple Top
was formed on 26.03 at 01:10:17 (UTC+0)
signal strength 1 of 5
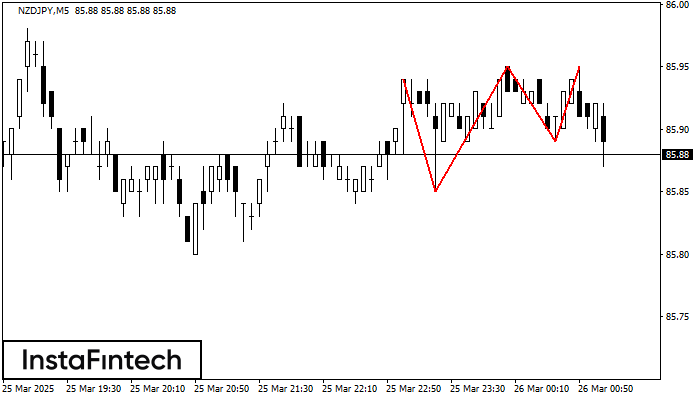
On the chart of the NZDJPY M5 trading instrument, the Triple Top pattern that signals a trend change has formed. It is possible that after formation of the third peak, the price will try to break through the resistance level 85.85, where we advise to open a trading position for sale. Take profit is the projection of the pattern’s width, which is 9 points.
The M5 and M15 time frames may have more false entry points.
- All
- All
- Bearish Rectangle
- Bearish Symmetrical Triangle
- Bearish Symmetrical Triangle
- Bullish Rectangle
- Double Top
- Double Top
- Triple Bottom
- Triple Bottom
- Triple Top
- Triple Top
- All
- All
- Buy
- Sale
- All
- 1
- 2
- 3
- 4
- 5
Bawah Triple
was formed on 21.05 at 10:00:16 (UTC+0)
signal strength 4 of 5
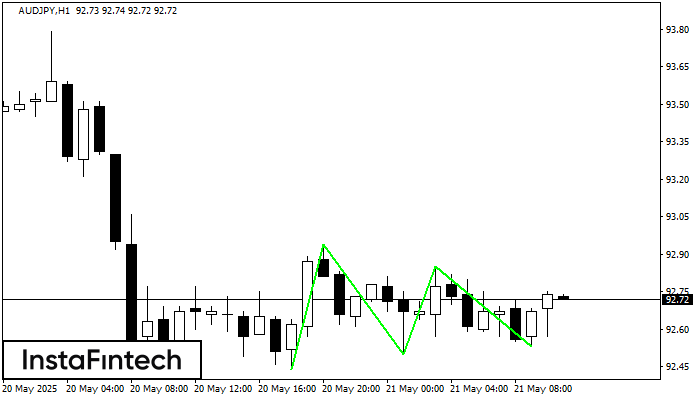
Pola Bawah Triple telah terbentuk pada AUDJPY H1. Pola tersebut memiliki karakteristik sebagai berikut: level resistance 92.94/92.85; level support 92.44/92.53; dengan lebar 50 poin. Jika terjadi pemecahan (breakdown) pada level
Open chart in a new window
Bawah Ganda
was formed on 21.05 at 10:00:05 (UTC+0)
signal strength 3 of 5
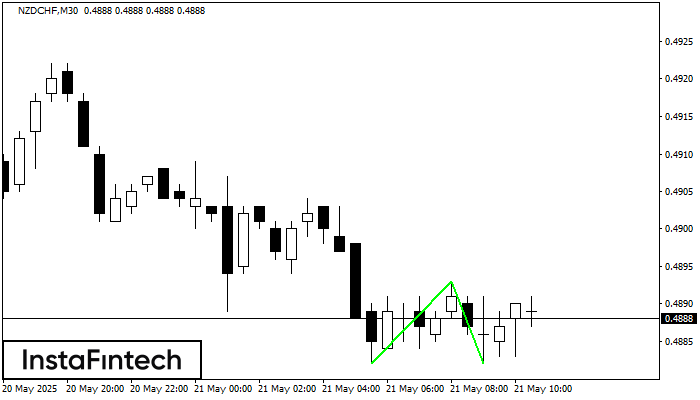
Pola Bawah Ganda telah terbentuk pada NZDCHF M30. Karakteristik: level support 0.4882; level resistance 0.4893; lebar pola 11 poin. Jika level resistance ditembus, perubahan dalam tren dapat diprediksi dengan target
Open chart in a new window
Bawah Ganda
was formed on 21.05 at 09:30:46 (UTC+0)
signal strength 2 of 5
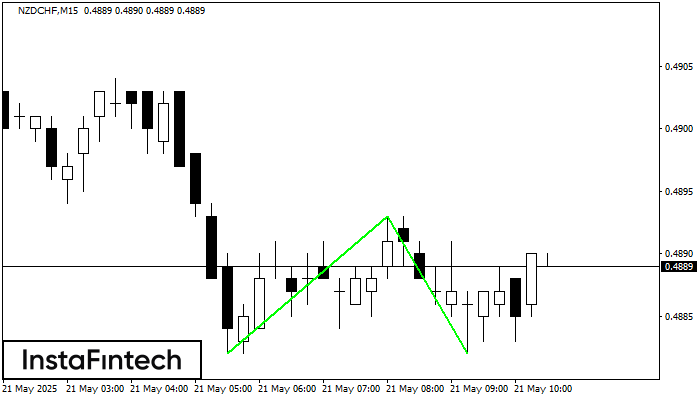
Pola Bawah Ganda telah terbentuk pada NZDCHF M15. Karakteristik: level support 0.4882; level resistance 0.4893; lebar pola 11 poin. Jika level resistance ditembus, perubahan dalam tren dapat diprediksi dengan target
Rangka waktu M5 dan M15 mungkin memiliki lebih dari titik entri yang keliru.
Open chart in a new window


