

Padrões atuais

Padrões são modelos gráficos que são formados no gráfico pelo preço. Segundo um dos postulados da análise técnica, a história (movimento de preços) se repete. Isso significa que os movimentos de preços geralmente são semelhantes nas mesmas situações, o que possibilita prever o desenvolvimento futuro da situação com alta probabilidade.
Os padrões relevantes da InstaTrade são um serviço fácil de usar, que permite que você esteja ciente das últimas mudanças no mercado e reaja a indícios do mercado a tempo. Em nosso serviço, você sempre encontrará os padrões mais recentes e relevantes em qualquer par e em qualquer período gráfico.
Double Bottom
was formed on 25.03 at 20:30:23 (UTC+0)
signal strength 2 of 5
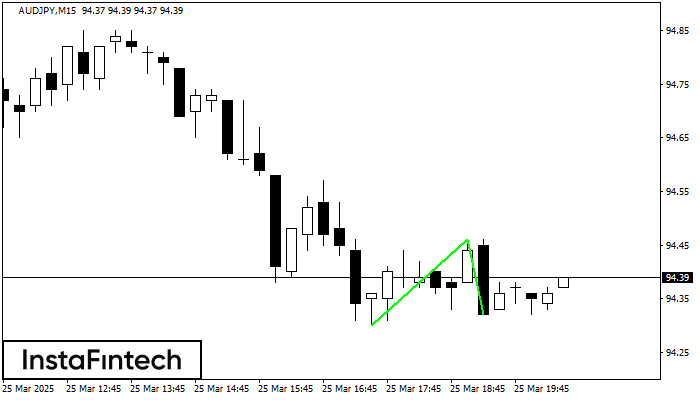
The Double Bottom pattern has been formed on AUDJPY M15. Characteristics: the support level 94.30; the resistance level 94.46; the width of the pattern 16 points. If the resistance level is broken, a change in the trend can be predicted with the first target point lying at the distance of 14 points.
The M5 and M15 time frames may have more false entry points.
- All
- All
- Bearish Rectangle
- Bearish Symmetrical Triangle
- Bearish Symmetrical Triangle
- Bullish Rectangle
- Double Top
- Double Top
- Triple Bottom
- Triple Bottom
- Triple Top
- Triple Top
- All
- All
- Buy
- Sale
- All
- 1
- 2
- 3
- 4
- 5
Прямоугольник
сформирован 23.05 в 23:00:20 (UTC+0)
сила сигнала 1 из 5

Сформирована фигура «Прямоугольник» на графике EURNZD M5. Тип фигуры: Продолжение тренда; Границы: Верхняя 1.8982, Нижняя 1.8964; Сигнал: позиция на продажу открывается после фиксации цены ниже границы прямоугольника 1.8964
Таймфреймы М5 и М15 могут иметь больше ложных точек входа.
Открыть график инструмента в новом окне
Бычий симметричный треугольник
сформирован 23.05 в 22:14:53 (UTC+0)
сила сигнала 1 из 5

По AUDCHF на M5 фигура «Бычий симметричный треугольник». Характеристика: Фигура продолжения тренда; Координаты границ – верхняя 0.5335, нижняя 0.5329. Проекция ширины фигуры 6 пунктов. Прогноз: В случае пробоя верхней границы
Таймфреймы М5 и М15 могут иметь больше ложных точек входа.
Открыть график инструмента в новом окне
Бычий симметричный треугольник
сформирован 23.05 в 22:10:58 (UTC+0)
сила сигнала 1 из 5

По AUDJPY на M5 фигура «Бычий симметричный треугольник». Характеристика: Фигура продолжения тренда; Координаты границ – верхняя 92.60, нижняя 92.44. Проекция ширины фигуры 16 пунктов. Прогноз: В случае пробоя верхней границы
Таймфреймы М5 и М15 могут иметь больше ложных точек входа.
Открыть график инструмента в новом окне


