

Padrões atuais

Padrões são modelos gráficos que são formados no gráfico pelo preço. Segundo um dos postulados da análise técnica, a história (movimento de preços) se repete. Isso significa que os movimentos de preços geralmente são semelhantes nas mesmas situações, o que possibilita prever o desenvolvimento futuro da situação com alta probabilidade.
Os padrões relevantes da InstaTrade são um serviço fácil de usar, que permite que você esteja ciente das últimas mudanças no mercado e reaja a indícios do mercado a tempo. Em nosso serviço, você sempre encontrará os padrões mais recentes e relevantes em qualquer par e em qualquer período gráfico.
Bullish pennant
was formed on 25.03 at 19:30:15 (UTC+0)
signal strength 4 of 5
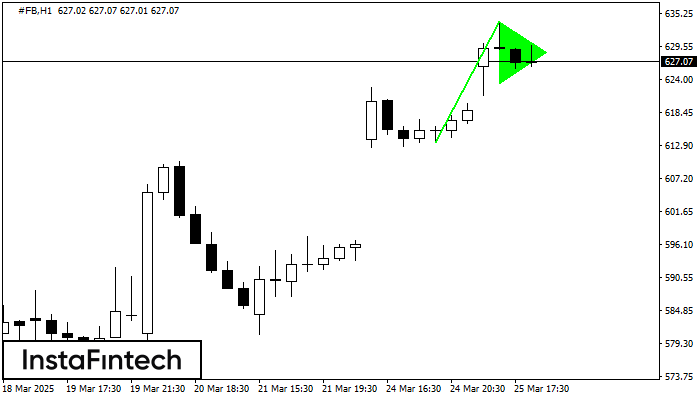
The Bullish pennant graphic pattern has formed on the #FB H1 instrument. This pattern type falls under the category of continuation patterns. In this case, if the quote can breaks out high, is expected to continue the upward trend to level 634.22.
- All
- All
- Bearish Rectangle
- Bearish Symmetrical Triangle
- Bearish Symmetrical Triangle
- Bullish Rectangle
- Double Top
- Double Top
- Triple Bottom
- Triple Bottom
- Triple Top
- Triple Top
- All
- All
- Buy
- Sale
- All
- 1
- 2
- 3
- 4
- 5
Bearish Rectangle
was formed on 23.05 at 18:20:42 (UTC+0)
signal strength 1 of 5
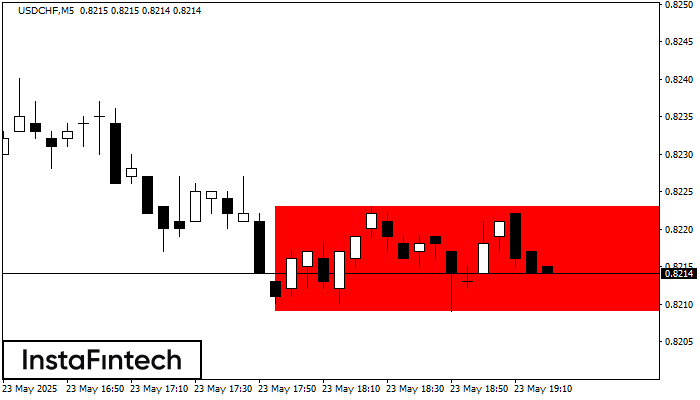
According to the chart of M5, USDCHF formed the Bearish Rectangle which is a pattern of a trend continuation. The pattern is contained within the following borders: lower border 0.8209
The M5 and M15 time frames may have more false entry points.
Open chart in a new window
Double Bottom
was formed on 23.05 at 18:05:32 (UTC+0)
signal strength 1 of 5
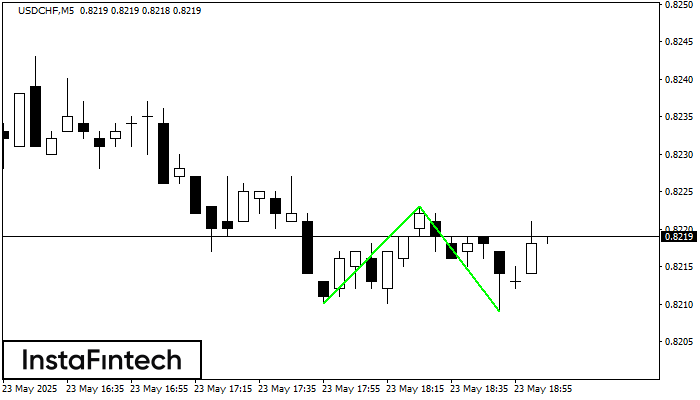
The Double Bottom pattern has been formed on USDCHF M5. Characteristics: the support level 0.8210; the resistance level 0.8223; the width of the pattern 13 points. If the resistance level
The M5 and M15 time frames may have more false entry points.
Open chart in a new window
Bearish Rectangle
was formed on 23.05 at 18:04:03 (UTC+0)
signal strength 1 of 5
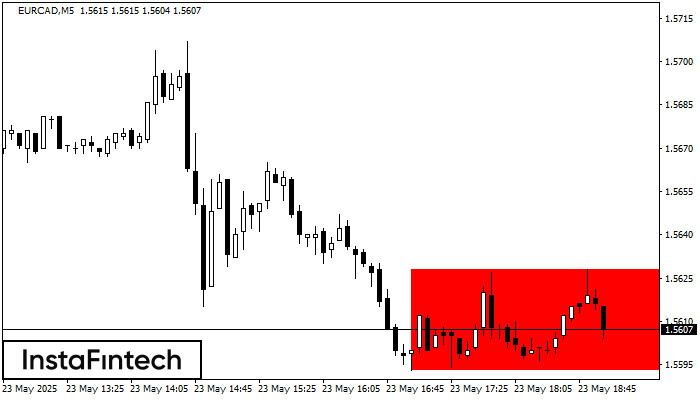
According to the chart of M5, EURCAD formed the Bearish Rectangle. This type of a pattern indicates a trend continuation. It consists of two levels: resistance 1.5628 - 0.0000
The M5 and M15 time frames may have more false entry points.
Open chart in a new window


