

Padrões atuais

Padrões são modelos gráficos que são formados no gráfico pelo preço. Segundo um dos postulados da análise técnica, a história (movimento de preços) se repete. Isso significa que os movimentos de preços geralmente são semelhantes nas mesmas situações, o que possibilita prever o desenvolvimento futuro da situação com alta probabilidade.
Os padrões relevantes da InstaTrade são um serviço fácil de usar, que permite que você esteja ciente das últimas mudanças no mercado e reaja a indícios do mercado a tempo. Em nosso serviço, você sempre encontrará os padrões mais recentes e relevantes em qualquer par e em qualquer período gráfico.
Double Bottom
was formed on 22.03 at 17:34:47 (UTC+0)
signal strength 1 of 5

The Double Bottom pattern has been formed on #Bitcoin M5. Characteristics: the support level 83931.70; the resistance level 84051.13; the width of the pattern 11943 points. If the resistance level is broken, a change in the trend can be predicted with the first target point lying at the distance of 10667 points.
The M5 and M15 time frames may have more false entry points.
- All
- All
- Bearish Rectangle
- Bearish Symmetrical Triangle
- Bearish Symmetrical Triangle
- Bullish Rectangle
- Double Top
- Double Top
- Triple Bottom
- Triple Bottom
- Triple Top
- Triple Top
- All
- All
- Buy
- Sale
- All
- 1
- 2
- 3
- 4
- 5
Pennant de alta
was formed on 22.05 at 16:15:44 (UTC+0)
signal strength 1 of 5
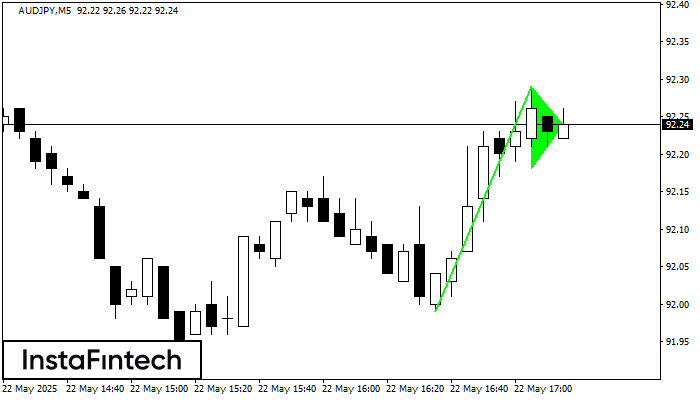
O padrão gráfico Pennant de alta foi formado no instrumento AUDJPY M5. Esse tipo de padrão se enquadra na categoria de padrões de continuação. Neste caso, se a cotação conseguir
Os intervalos M5 e M15 podem ter mais pontos de entrada falsos.
Open chart in a new window
Fundo duplo
was formed on 22.05 at 16:00:12 (UTC+0)
signal strength 2 of 5
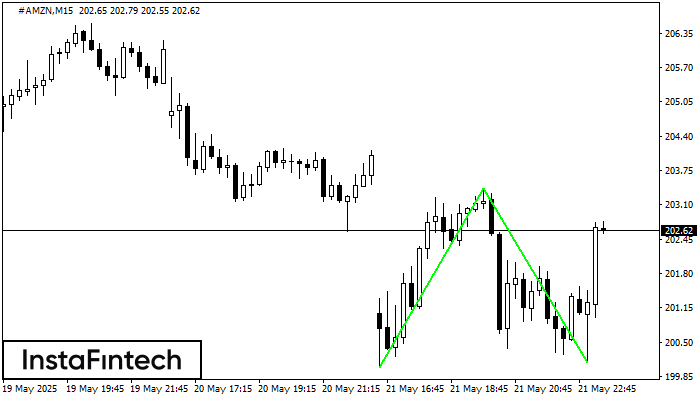
O padrão Fundo duplo foi formado em #AMZN M15; o limite superior é 203.40; o limite inferior é 200.12. A largura do padrão é de 338 pontos. No caso
Os intervalos M5 e M15 podem ter mais pontos de entrada falsos.
Open chart in a new window
Fundo duplo
was formed on 22.05 at 16:00:12 (UTC+0)
signal strength 3 of 5
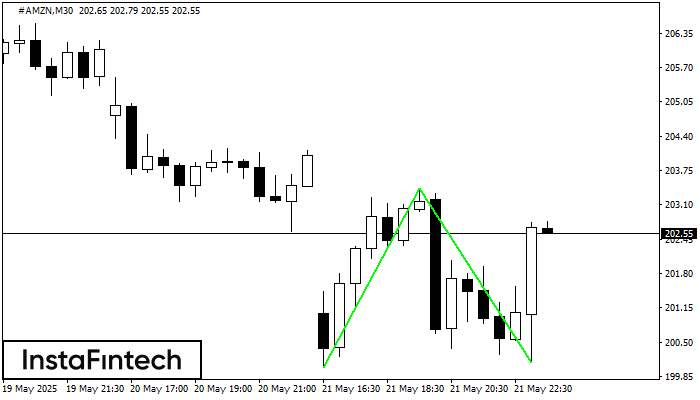
O padrão Fundo duplo foi formado em #AMZN M30. Esta formação sinaliza uma reversão da tendência de baixo para cima. O sinal é que uma negociação de compra deve
Open chart in a new window


