Veja também


 19.03.2025 06:36 AM
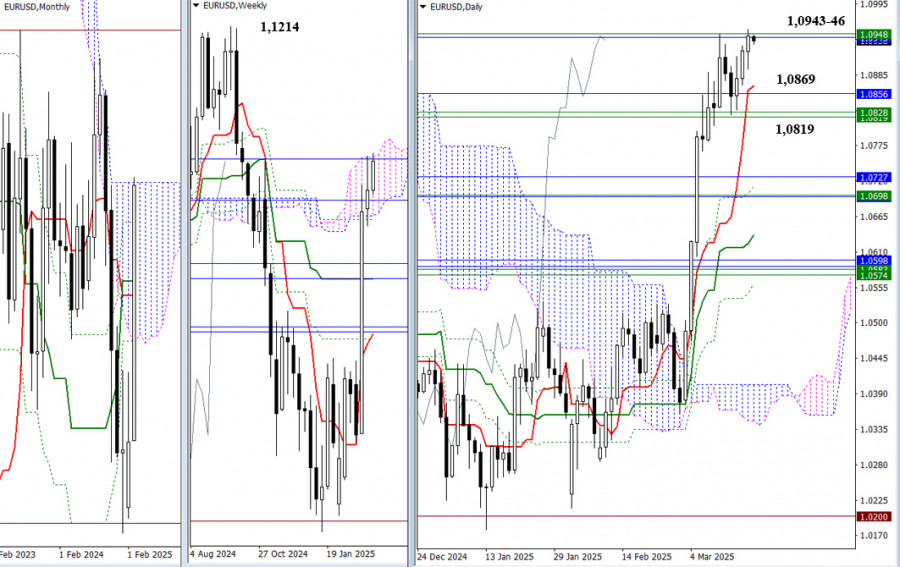
The pair is currently testing the upper boundaries of the monthly Ichimoku cloud at 1.0943 and the weekly cloud at 1.0946. If buyers can consolidate in the bullish zone relative to these clouds, they will open up new opportunities and set upward targets to break through the cloud. The next bullish targets are the nearest extreme highs at 1.1214 and 1.1276. However, if the current resistance levels (1.0943-1.0946) are able to push the market back again, as it did last week, we could see a pullback and a daily downward correction that brings the price back toward the support cluster around 1.0819 to 1.0856, as well as the daily short-term trend at 1.0869. Consolidation below these levels would shift sentiment on the weekly timeframe, causing the pair to return to the bearish zone relative to the weekly cloud.
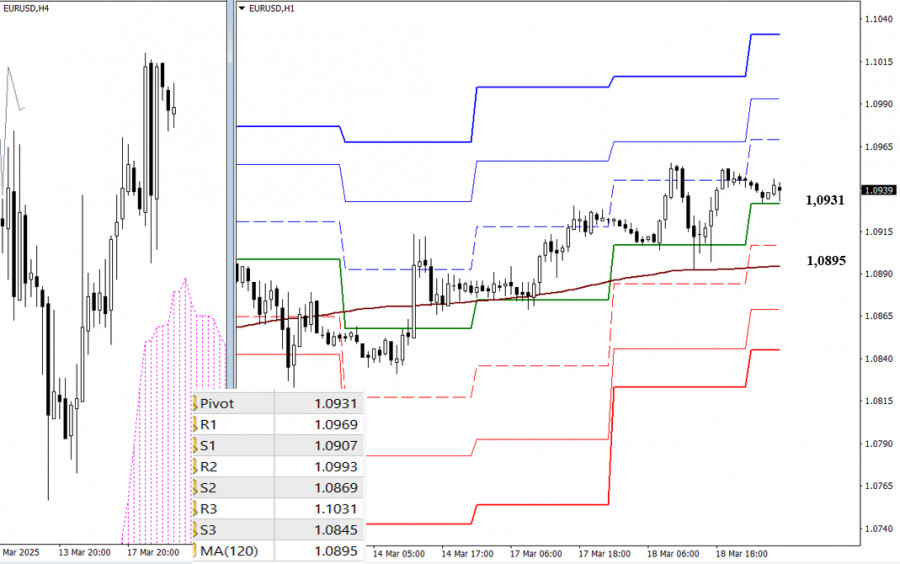
On lower timeframes, bulls currently have the advantage. Key levels for further upward movement today are 1.0969, 1.0993, and 1.1031, which are resistance levels based on classic Pivot points. If the current support at the central Pivot level (1.0931) is broken and a downward corrective move develops, the most significant test will be the long-term weekly trend at 1.0895. A breakout and reversal of this trend could shift the balance of power toward a stronger bearish sentiment. Additional intraday bearish targets include the classic Pivot support levels at 1.0907, 1.0869, and 1.0845.
***
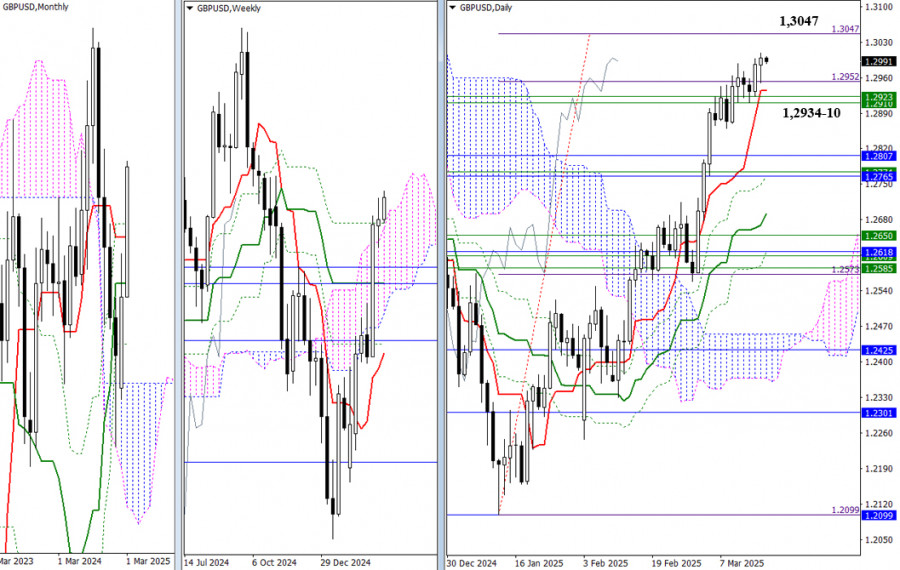
The currency pair has recently updated last week's high of 1.2988 and continues to rise gradually. The next target is the 100% completion level at 1.3047. If it successfully reaches the daily breakout target of the cloud and consolidates above this level, buyers will have the opportunity to explore new bullish prospects. However, if there is another failure, the market could retrace toward the support cluster at 1.2934, 1.2923, and 1.2910, which align with daily short-term trends and weekly levels. A firm consolidation below these levels could foster a bearish sentiment.
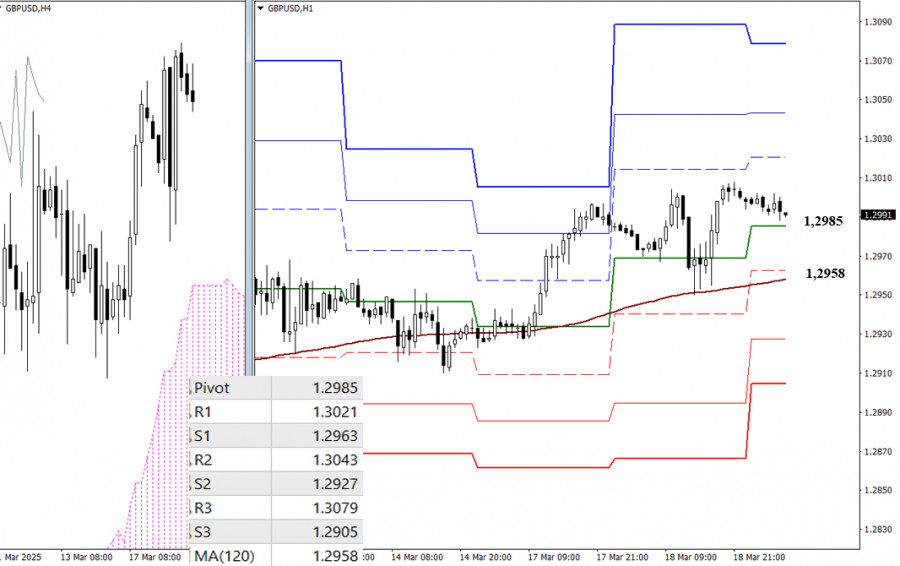
On lower timeframes, bulls currently maintain the upper hand. If the upward movement persists, key levels to monitor for breakouts include the classic Pivot resistance levels at 1.3021, 1.3043, and 1.3079. Conversely, if a correction gains momentum, the most critical level to test and break would be the long-term weekly trend at 1.2958. A shift in focus toward the downside could reinforce the bearish sentiment and create new opportunities for sellers, with additional support levels at 1.2927 and 1.2905, based on Pivot levels.
***
You have already liked this post today
*A análise de mercado aqui postada destina-se a aumentar o seu conhecimento, mas não dar instruções para fazer uma negociação.
No início da sessão europeia, o euro está sendo negociado em torno de 1,1440, passando por uma correção técnica após ter testado o nível psicológico de 1,1500. Os dados
Por outro lado, o ouro deve passar por uma correção técnica. Em 30 de maio, ele deixou uma lacuna em torno de 3.284 e, se consolidar abaixo de 3.350, provavelmente
O indicador Eagle está mostrando um sinal negativo para o euro, sugerindo uma possível queda nos próximos dias. Portanto, nossa perspectiva permanece de baixa, enquanto o preço se consolidar abaixo
Gráfico de Forex
Versão-Web

Your IP address shows that you are currently located in the USA. If you are a resident of the United States, you are prohibited from using the services of InstaFintech Group including online trading, online transfers, deposit/withdrawal of funds, etc.
If you think you are seeing this message by mistake and your location is not the US, kindly proceed to the website. Otherwise, you must leave the website in order to comply with government restrictions.
Why does your IP address show your location as the USA?
Please confirm whether you are a US resident or not by clicking the relevant button below. If you choose the wrong option, being a US resident, you will not be able to open an account with InstaTrade anyway.
We are sorry for any inconvenience caused by this message.


