Veja também


 07.02.2025 07:11 AM
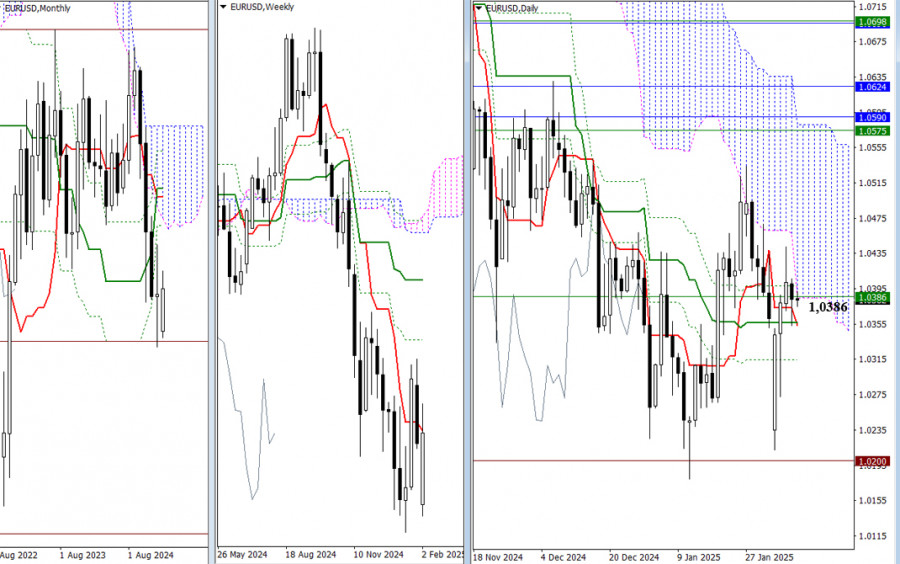
The market has risen into a resistance cluster zone between 1.0356 and 1.0398 and is currently consolidating. The key gravitational point for the short-term weekly trend is at 1.0386. Other significant levels remain unchanged. If bullish momentum continues, the market will aim for the upper boundary of the daily Ichimoku cloud at 1.0581, as well as the monthly Ichimoku cloud range of 1.0590 to 1.0624. For bearish traders, the primary objective to reverse the downtrend would be to break through historical support at 1.0200 and update the minimum low at 1.0176.
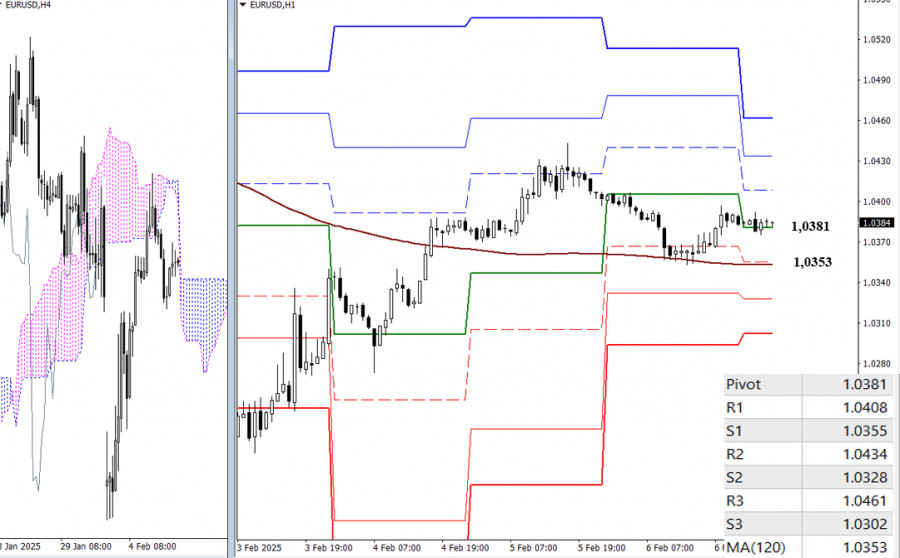
On the lower timeframes, bullish participants currently have the upper hand. The key levels for today are 1.0381 to 1.0353, which include the daily central Pivot Point and the weekly long-term trend, supporting bullish sentiment. Intraday upside targets include the resistance levels of the classic Pivot Points at 1.0408, 1.0434, and 1.0461.
A breakout and subsequent trend reversal could shift market sentiment, bringing the support levels of the classic Pivot levels at 1.0328 and 1.0302 back into focus.
***
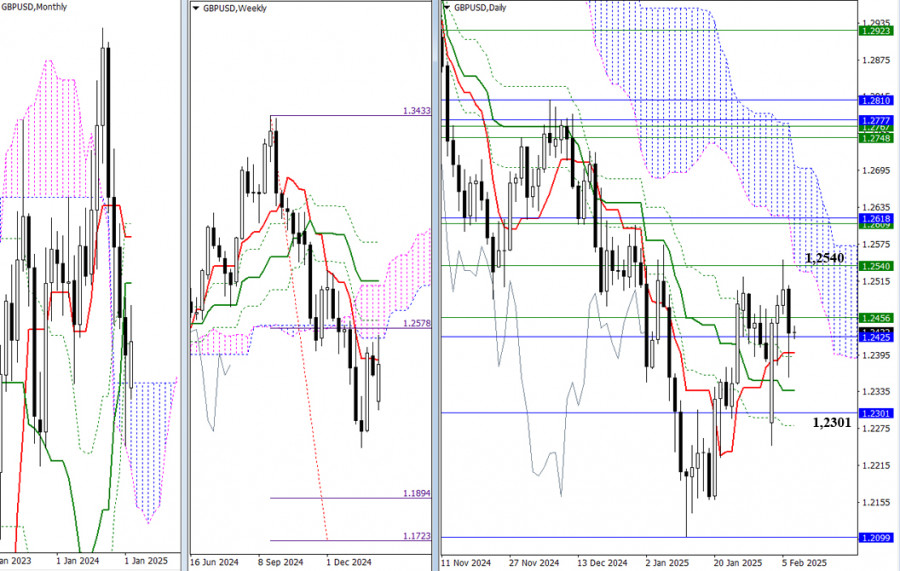
The bulls closed the downward gap and tested the lower boundary of the weekly cloud at 1.2540. If bullish sentiment continues to strengthen, the pound may consolidate in the Ichimoku clouds on both the daily and weekly timeframes. This would pave the way for a move toward the monthly mid-term trend at 1.2618.
However, if the upward movement cannot be maintained, the pair will likely remain within its current range (1.2456 – 1.2425 – 1.2399). For bears to regain control and open up new opportunities, they need to invalidate the daily Ichimoku cross at 1.2280 and consolidate in the monthly Ichimoku cloud, which is at 1.2301.
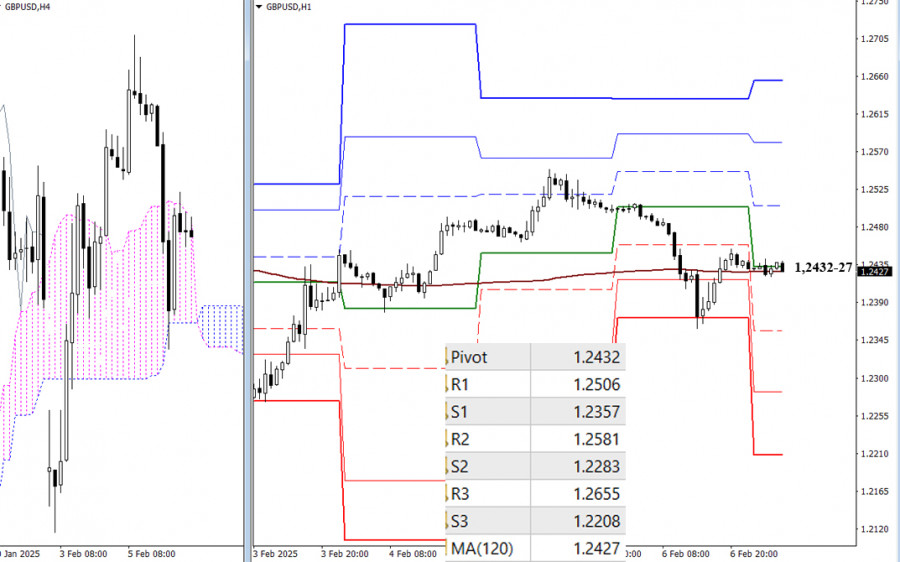
In the lower timeframes, the market has been hovering around the key levels of 1.2332-27, which represent the central Pivot level of the day and the long-term weekly trend. This period of uncertainty, no matter how prolonged, will eventually come to an end. Once directional movement occurs intraday, the classic Pivot levels will come into focus.
For those looking to short the market, important support levels are at 1.2357, 1.2283, and 1.2208. Conversely, resistance levels of the classic Pivot are critical for those looking to take long positions, with key resistance points at 1.2506, 1.2581, and 1.2655.
***
You have already liked this post today
*A análise de mercado aqui postada destina-se a aumentar o seu conhecimento, mas não dar instruções para fazer uma negociação.
Petróleo Bruto, Quinta-feira, 03 de Julho de 2025. As fracas condições econômicas globais, como a estagnação da atividade industrial chinesa e europeia, geraram preocupações sobre a demanda mundial por petróleo
Índice Nasdaq 100, quinta-feira, 3 de julho de 2025. Os relatórios financeiros positivos das grandes empresas de tecnologia, os rumores cada vez mais fortes sobre a política dovish
Conforme mencionado anteriormente em diversas ocasiões, a força das principais moedas negociadas contra o dólar norte-americano no mercado cambial (Forex) baseava-se unicamente na fraqueza fundamental da moeda americana, provocada pela
Se o euro romper abaixo de 1,1762 e se consolidar abaixo dessa zona de preço, é possível uma aceleração de baixa. Portanto, o EUR/USD pode atingir a parte inferior
O ouro pode estar se preparando para uma nova sequência de alta, de modo que o preço se consolide acima de 3.325 ou 3.312. Qualquer recuperação técnica será vista como
Your IP address shows that you are currently located in the USA. If you are a resident of the United States, you are prohibited from using the services of InstaFintech Group including online trading, online transfers, deposit/withdrawal of funds, etc.
If you think you are seeing this message by mistake and your location is not the US, kindly proceed to the website. Otherwise, you must leave the website in order to comply with government restrictions.
Why does your IP address show your location as the USA?
Please confirm whether you are a US resident or not by clicking the relevant button below. If you choose the wrong option, being a US resident, you will not be able to open an account with InstaTrade anyway.
We are sorry for any inconvenience caused by this message.


