

Actual patterns

Patterns are graphical models which are formed in the chart by the price. According to one of the technical analysis postulates, history (price movement) repeats itself. It means that the price movements are often similar in the same situations which makes it possible to predict the further development of the situation with a high probability.
Relevant patterns by InstaTrade is an easy-to-use service which allows you to be aware of latest changes in the market and react to clues from the market in time. In our service you will always find the latest and most relevant patterns on any pair and any timeframe.
Bullish Rectangle
was formed on 14.04 at 13:57:45 (UTC+0)
signal strength 1 of 5
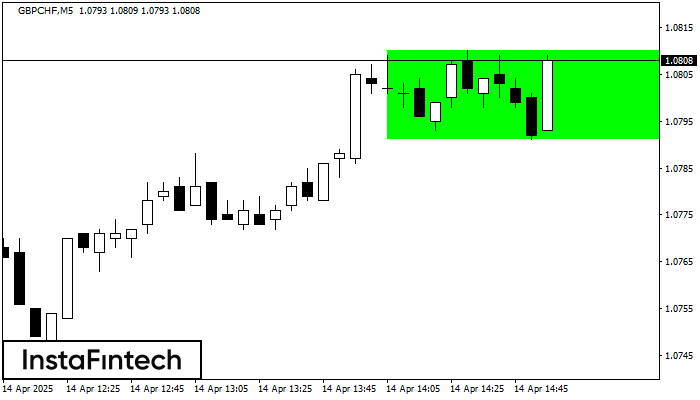
According to the chart of M5, GBPCHF formed the Bullish Rectangle. The pattern indicates a trend continuation. The upper border is 1.0810, the lower border is 1.0791. The signal means that a long position should be opened above the upper border 1.0810 of the Bullish Rectangle.
The M5 and M15 time frames may have more false entry points.
See Also
- All
- All
- Bearish Rectangle
- Bearish Symmetrical Triangle
- Bearish Symmetrical Triangle
- Bullish Rectangle
- Double Top
- Double Top
- Triple Bottom
- Triple Bottom
- Triple Top
- Triple Top
- All
- All
- Buy
- Sale
- All
- 1
- 2
- 3
- 4
- 5
Triple Top
сформирован 06.06 в 14:30:03 (UTC+0)
сила сигнала 3 из 5
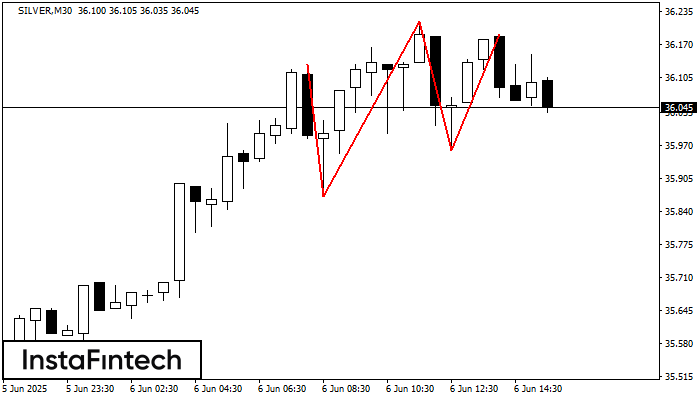
The Triple Top pattern has formed on the chart of the SILVER M30. Features of the pattern: borders have an ascending angle; the lower line of the pattern
Открыть график инструмента в новом окне
Head and Shoulders
сформирован 06.06 в 14:30:02 (UTC+0)
сила сигнала 3 из 5
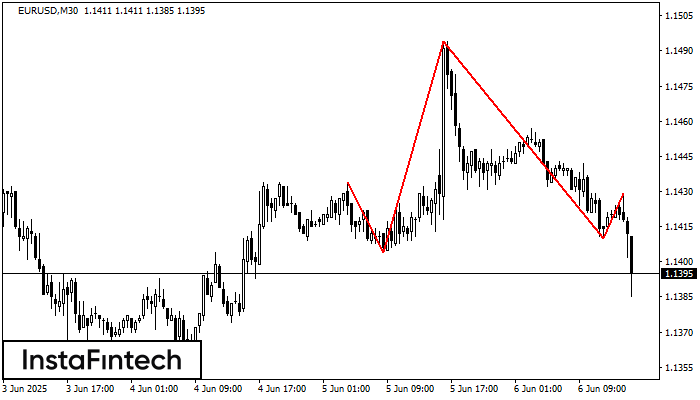
According to the chart of M30, EURUSD formed the Head and Shoulders pattern. The Head’s top is set at 1.1494 while the median line of the Neck is found
Открыть график инструмента в новом окне
Bullish Flag
сформирован 06.06 в 14:30:00 (UTC+0)
сила сигнала 2 из 5
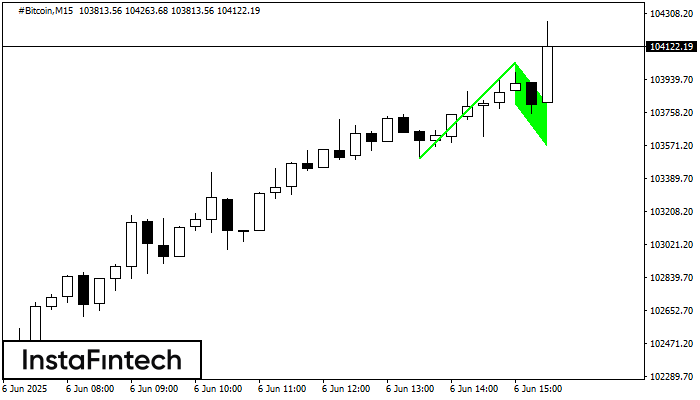
The Bullish Flag pattern has been formed on the chart #Bitcoin M15 which signals that the upward trend will continue. Signals: а break of the peak at 104036.62 may push
The M5 and M15 time frames may have more false entry points.
Открыть график инструмента в новом окне


