
#N225 (Nikkei 225). Exchange rate and online charts.
Currency converter
24 Mar 2025 05:06
(0.02%)
Closing price, the previous day.
Opening price.
The highest price over the last trading day.
The lowest price over the last trading day
Price range high in the last week
Price range low in the last week
The Nikkei-225 Stock Average is one of the major Japanese stock indices. It is a price-weighted average of 225 top-rated Japanese companies listed in the First Section of the Tokyo Stock Exchange. The Nikkei 225 began to be calculated on September 7, 1950. Its first name was TSE Adjusted Average Price. Since 1970, the index has been calculated by the Japanese newspaper Nihon Keizai Shimbun.
The components of the Nikkei 225 are reviewed once a year. In case stocks of a company are no longer liquid, they may be replaced by other companies. Previously, the index had been subject to changes only in case of merger or liquidation of firms. The Nikkei’s all-time high of 38,915.87 points was recorded in late 1989, while its all-time low of 7,607.88 was reached on April 28, 2003. Currently, the index is gradually rising.
Futures on the Nikkei 225 provide investors from all over the world with a great opportunity to take advantage of the Japanese stock market fluctuations. In order to trade the Nikkei 225 in a right way, traders are recommended to do it precisely at the opening of the Japanese session. It is also interesting to note that the US economy has a strong impact on the Nikkei 225, but these effects are seen only within the first hour after trades on Tokyo Stock Exchange are opened.
See Also
- The GBP/USD pair declined by 25 basis points on Friday heading into the U.S. session.
Author: Chin Zhao
19:42 2025-03-21 UTC+2
2713
Today, following the release of data showing a February slowdown in the national Consumer Price Index (CPI), the Japanese yen continues to trade with a negative tone, creating uncertainty in the market.Author: Irina Yanina
12:07 2025-03-21 UTC+2
2593
Bulls had the upper hand for two weeks, but it's time for a pauseAuthor: Samir Klishi
12:02 2025-03-21 UTC+2
2563
- Technical analysis
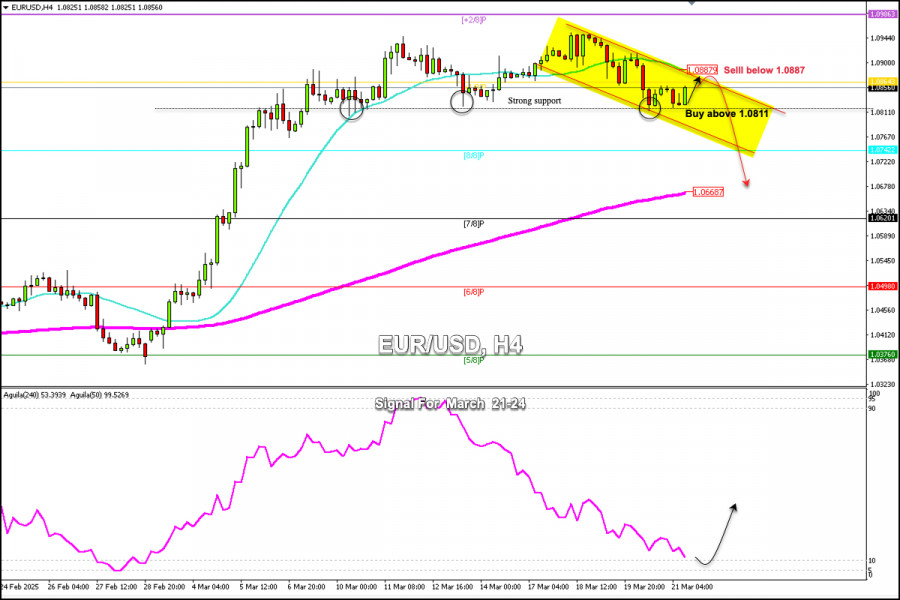
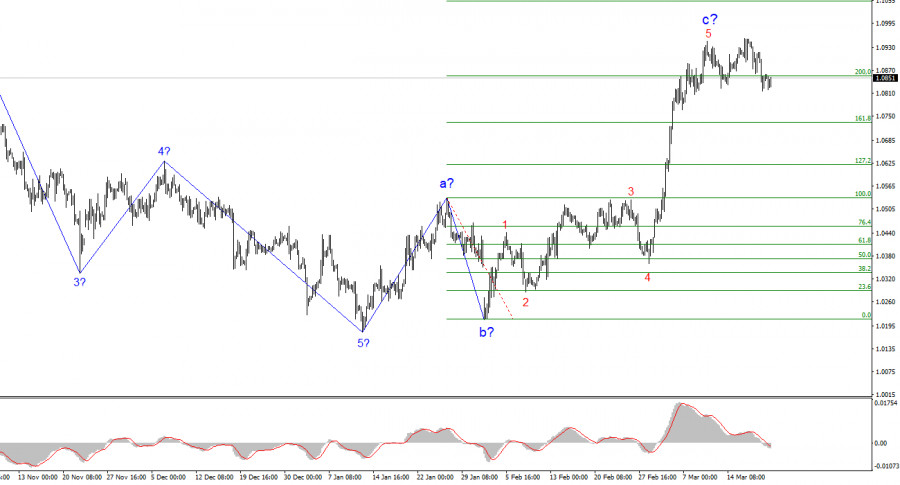
Trading Signals for EUR/USD for March 21-24, 2025: buy above 1.0810 (+1/8Murray - rebound)
Our medium-term forecast remains bearish. So, any technical rebound will be seen as a signal to sell with a medium-term target at about 1.0361, the level where the instrument left a gap.Author: Dimitrios Zappas
14:22 2025-03-21 UTC+2
2533
Technical analysis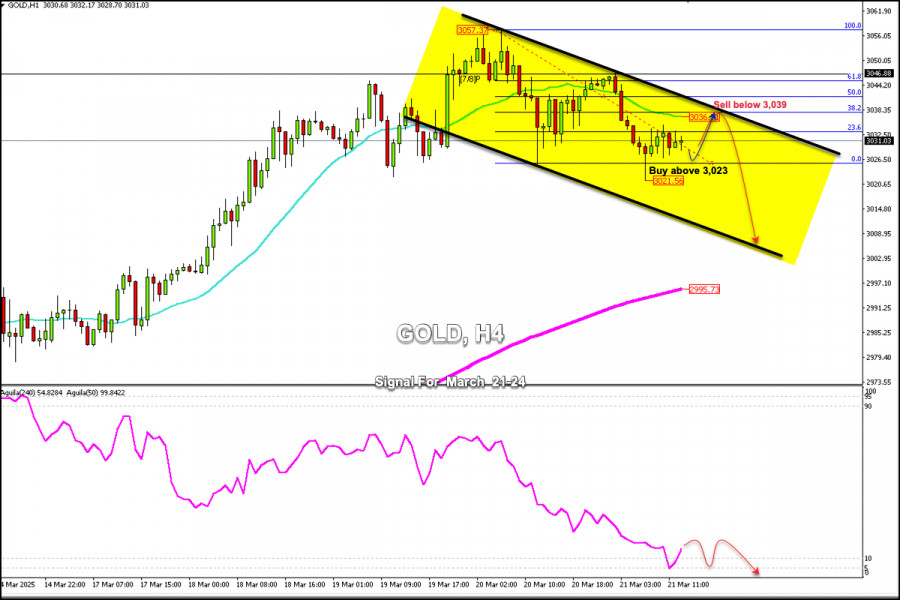
Trading Signals for GOLD (XAU/USD) for March 21-24, 2025: buy above $3,026 (7/8 Murray - 61.8%)
The Eagle indicator is reaching oversold levels. So, we believe that gold could resume its bullish cycle in the coming days. For this, we should expect consolidation above the psychological level of $3,000.Author: Dimitrios Zappas
14:04 2025-03-21 UTC+2
2458
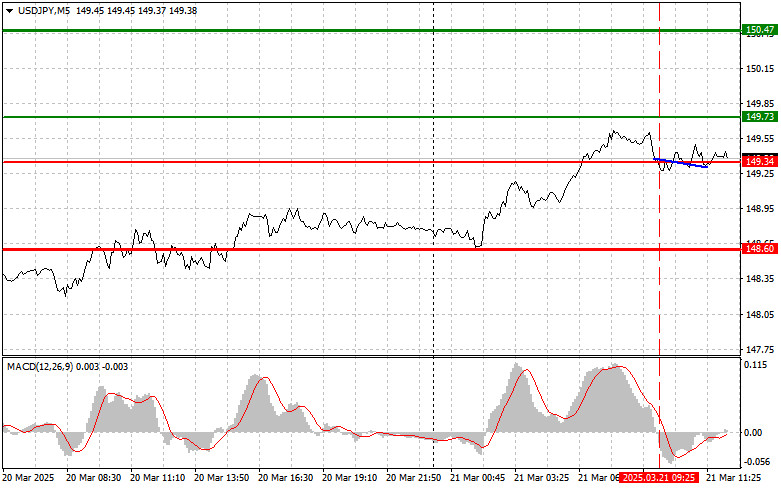
USDJPY: Simple Trading Tips for Beginner Traders on March 21st (U.S. Session)Author: Jakub Novak
19:30 2025-03-21 UTC+2
2353
- The EUR/USD pair saw no change on Friday. There was no news background in the direct sense of the word today, so the market had nothing to respond to, and trader activity remained minimal.
Author: Chin Zhao
19:39 2025-03-21 UTC+2
2323
US stock market in limbo despite positive economic dataAuthor: Andreeva Natalya
15:48 2025-03-21 UTC+2
2233
The outcomes of the Bank of England and FOMC meetings contradicted each otherAuthor: Samir Klishi
11:52 2025-03-21 UTC+2
2143


- The GBP/USD pair declined by 25 basis points on Friday heading into the U.S. session.
Author: Chin Zhao
19:42 2025-03-21 UTC+2
2713
- Today, following the release of data showing a February slowdown in the national Consumer Price Index (CPI), the Japanese yen continues to trade with a negative tone, creating uncertainty in the market.
Author: Irina Yanina
12:07 2025-03-21 UTC+2
2593
- Bulls had the upper hand for two weeks, but it's time for a pause
Author: Samir Klishi
12:02 2025-03-21 UTC+2
2563
- Technical analysis
Trading Signals for EUR/USD for March 21-24, 2025: buy above 1.0810 (+1/8Murray - rebound)
Our medium-term forecast remains bearish. So, any technical rebound will be seen as a signal to sell with a medium-term target at about 1.0361, the level where the instrument left a gap.Author: Dimitrios Zappas
14:22 2025-03-21 UTC+2
2533
- Technical analysis
Trading Signals for GOLD (XAU/USD) for March 21-24, 2025: buy above $3,026 (7/8 Murray - 61.8%)
The Eagle indicator is reaching oversold levels. So, we believe that gold could resume its bullish cycle in the coming days. For this, we should expect consolidation above the psychological level of $3,000.Author: Dimitrios Zappas
14:04 2025-03-21 UTC+2
2458
- USDJPY: Simple Trading Tips for Beginner Traders on March 21st (U.S. Session)
Author: Jakub Novak
19:30 2025-03-21 UTC+2
2353
- The EUR/USD pair saw no change on Friday. There was no news background in the direct sense of the word today, so the market had nothing to respond to, and trader activity remained minimal.
Author: Chin Zhao
19:39 2025-03-21 UTC+2
2323
- US stock market in limbo despite positive economic data
Author: Andreeva Natalya
15:48 2025-03-21 UTC+2
2233
- The outcomes of the Bank of England and FOMC meetings contradicted each other
Author: Samir Klishi
11:52 2025-03-21 UTC+2
2143


