یہ بھی دیکھیں


 11.01.2024 12:03 PM
On Wednesday, the macroeconomic calendar remained empty, with no important statistical data published in the European Union, the United Kingdom, or the United States. However, within the context of the information flow, there was a speech by the Vice-President of the European Central Bank (ECB), Luis de Guindos. In his address, he almost directly stated that the regulator would be one of the first to begin easing its monetary policy. This statement garnered significant interest, but the market reacted to it cautiously.
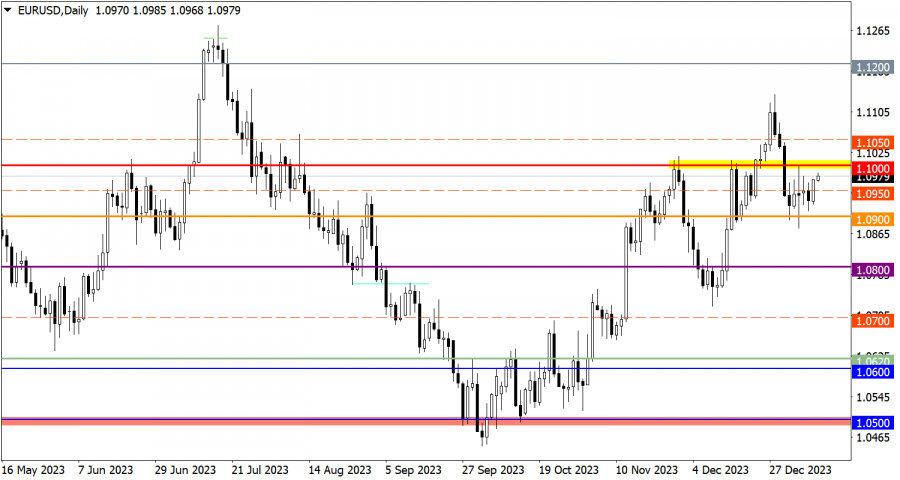
Despite the euro's appreciation against the dollar, the quote ended the previous day within the confines of recent stagnation.
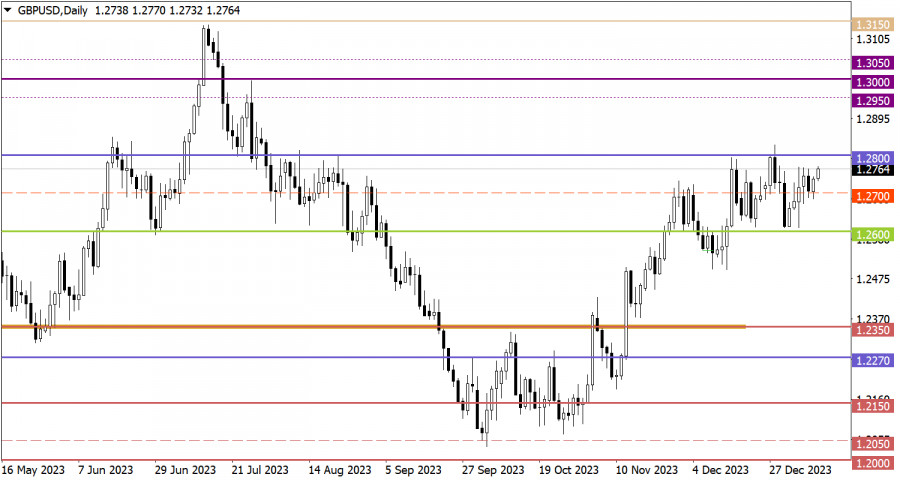
The GBP/USD currency pair demonstrated an upward dynamic, based on which the price nearly reached the upper limit of the lateral channel 1.2600/1.2800.
Today is a key day in terms of the macroeconomic calendar, as inflation data in the United States is expected to be published. According to forecasts from analytical agencies, inflation is expected to remain at the previous level of 3.1%. However, the consensus forecast suggests an increase to 3.2%. An inflation rise would slow down the process of considering a scenario for easing monetary policy sooner, which could support the value of the U.S. currency.
Buyers face resistance at the 1.1000 level, approaching which could lead to an increase in short positions. In this scenario, the quote might return below the 1.0950 mark. Nevertheless, a sustained stabilization of the price above the 1.1000 level, at least on a four-hour chart, could contribute to further growth of the euro. This price move would indicate a recovery of the euro's value after a correction cycle.
From a technical analysis standpoint, the tactic of working based on a lateral channel is divided into two stages: rebound and breakout. The first stage involves temporary fluctuation, which ultimately leads to the accumulation of trading forces and transition to the second stage. The breakout method represents the main stage, which can lead to subsequent price movement.
The candlestick chart type is white and black graphic rectangles with lines above and below. With a detailed analysis of each individual candle, you can see its characteristics relative to a particular time frame: opening price, closing price, intraday high and low.
Horizontal levels are price coordinates, relative to which a price may stop or reverse its trajectory. In the market, these levels are called support and resistance.
Circles and rectangles are highlighted examples where the price reversed in history. This color highlighting indicates horizontal lines that may put pressure on the asset's price in the future.
The up/down arrows are landmarks of the possible price direction in the future.
You have already liked this post today
*تعینات کیا مراد ہے مارکیٹ کے تجزیات یہاں ارسال کیے جاتے ہیں جس کا مقصد آپ کی بیداری بڑھانا ہے، لیکن تجارت کرنے کے لئے ہدایات دینا نہیں.
پیر کی تجارت کا تجزیہ یورو/امریکی ڈالر کا 1 گھنٹے چارٹ کا تجزیہ پیر کے روز، برطانوی پاؤنڈ/امریکی ڈالر کا جوڑا بھی تیزی سے گر گیا، حالانکہ یہ کہنا زیادہ
جمعہ کی تجارت کا تجزیہ برطانوی پاؤنڈ/امریکی ڈالر کا 1 گھنٹے کا چارٹ جمعہ کو، برطانوی پاؤنڈ/امریکی ڈالر کی کرنسی کے جوڑے نے بڑھنے کا رجحان ظاہر کیا۔ جیسا
جمعرات کی تجارت کا تجزیہ یورو/امریکی ڈالر کا 1 گھنٹے چارٹ کا تجزیہ جمعہ کو، یورو/امریکی ڈالرکی کرنسی کے جوڑے نے کافی تکنیکی اور متوقع انداز میں تجارت کی۔ امریکی
تربیتی ویڈیو

Your IP address shows that you are currently located in the USA. If you are a resident of the United States, you are prohibited from using the services of InstaFintech Group including online trading, online transfers, deposit/withdrawal of funds, etc.
If you think you are seeing this message by mistake and your location is not the US, kindly proceed to the website. Otherwise, you must leave the website in order to comply with government restrictions.
Why does your IP address show your location as the USA?
Please confirm whether you are a US resident or not by clicking the relevant button below. If you choose the wrong option, being a US resident, you will not be able to open an account with InstaTrade anyway.
We are sorry for any inconvenience caused by this message.


