

Actual patterns

Patterns are graphical models which are formed in the chart by the price. According to one of the technical analysis postulates, history (price movement) repeats itself. It means that the price movements are often similar in the same situations which makes it possible to predict the further development of the situation with a high probability.
Relevant patterns by InstaTrade is an easy-to-use service which allows you to be aware of latest changes in the market and react to clues from the market in time. In our service you will always find the latest and most relevant patterns on any pair and any timeframe.
Bearish Flag
was formed on 30.04 at 02:45:54 (UTC+0)
signal strength 4 of 5

The Bearish Flag pattern has been formed on the chart NZDCAD H1 which signals that the downward trend will continue. If the price breaks below the low at 0.8194, then it is most likely to move further downwards. The price will likely move by the number of points which equals the length of the flag pole (20 points).
- All
- All
- Bearish Rectangle
- Bearish Symmetrical Triangle
- Bearish Symmetrical Triangle
- Bullish Rectangle
- Double Top
- Double Top
- Triple Bottom
- Triple Bottom
- Triple Top
- Triple Top
- All
- All
- Buy
- Sale
- All
- 1
- 2
- 3
- 4
- 5
Bullish Rectangle
was formed on 02.05 at 16:26:31 (UTC+0)
signal strength 1 of 5
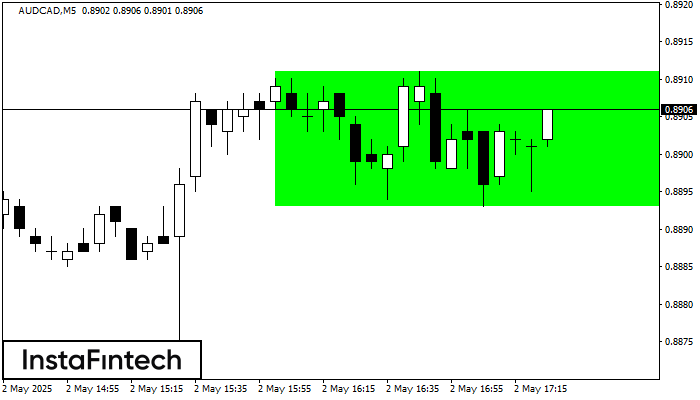
According to the chart of M5, AUDCAD formed the Bullish Rectangle. This type of a pattern indicates a trend continuation. It consists of two levels: resistance 0.8911 and support 0.8893
The M5 and M15 time frames may have more false entry points.
Open chart in a new window
Double Top
was formed on 02.05 at 16:05:28 (UTC+0)
signal strength 1 of 5
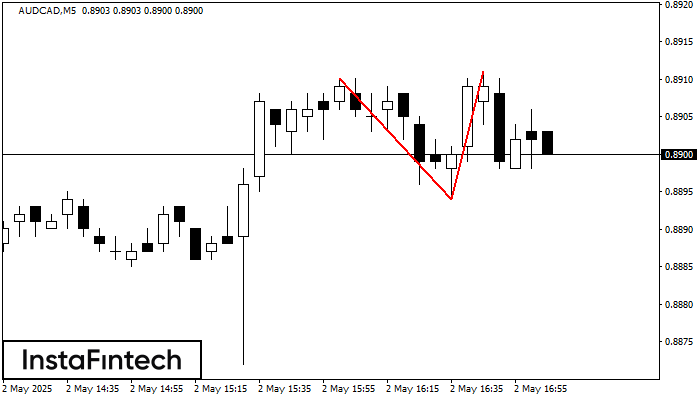
On the chart of AUDCAD M5 the Double Top reversal pattern has been formed. Characteristics: the upper boundary 0.8911; the lower boundary 0.8894; the width of the pattern 17 points
The M5 and M15 time frames may have more false entry points.
Open chart in a new window
Head and Shoulders
was formed on 02.05 at 15:40:20 (UTC+0)
signal strength 1 of 5
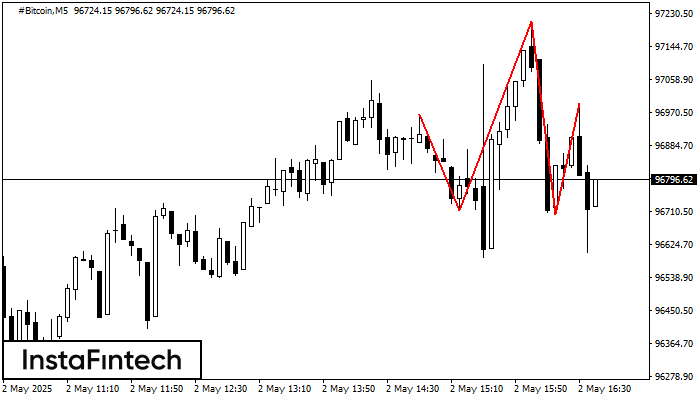
The technical pattern called Head and Shoulders has appeared on the chart of #Bitcoin M5. There are weighty reasons to suggest that the price will surpass the Neckline 96714.23/96704.41 after
The M5 and M15 time frames may have more false entry points.
Open chart in a new window


