

Actual patterns

Patterns are graphical models which are formed in the chart by the price. According to one of the technical analysis postulates, history (price movement) repeats itself. It means that the price movements are often similar in the same situations which makes it possible to predict the further development of the situation with a high probability.
Relevant patterns by InstaTrade is an easy-to-use service which allows you to be aware of latest changes in the market and react to clues from the market in time. In our service you will always find the latest and most relevant patterns on any pair and any timeframe.
Double Bottom
was formed on 25.04 at 13:45:23 (UTC+0)
signal strength 1 of 5
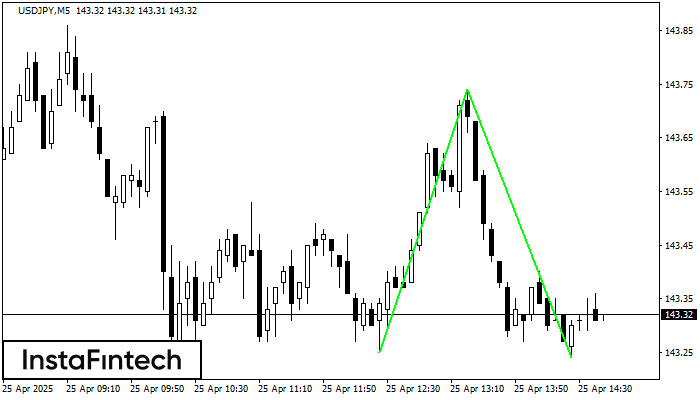
The Double Bottom pattern has been formed on USDJPY M5. Characteristics: the support level 143.25; the resistance level 143.74; the width of the pattern 49 points. If the resistance level is broken, a change in the trend can be predicted with the first target point lying at the distance of 50 points.
The M5 and M15 time frames may have more false entry points.
- All
- All
- Bearish Rectangle
- Bearish Symmetrical Triangle
- Bearish Symmetrical Triangle
- Bullish Rectangle
- Double Top
- Double Top
- Triple Bottom
- Triple Bottom
- Triple Top
- Triple Top
- All
- All
- Buy
- Sale
- All
- 1
- 2
- 3
- 4
- 5
Triángulo Simétrico Bajista
was formed on 01.05 at 20:55:45 (UTC+0)
signal strength 1 of 5
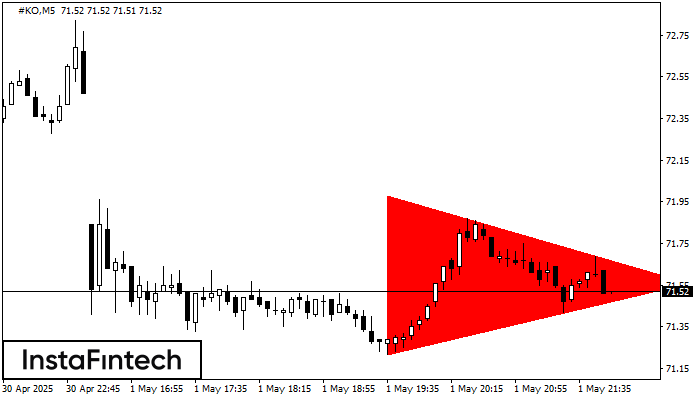
Según el gráfico de M5, el #KO formó el patrón Triángulo Simétrico Bajista. Este patrón señala una tendencia bajista en caso de que el límite inferior 71.22 sea roto. Aquí
Los marcos de tiempo M5 y M15 pueden tener más puntos de entrada falsos.
Open chart in a new window
Doble Piso
was formed on 01.05 at 20:45:19 (UTC+0)
signal strength 2 of 5
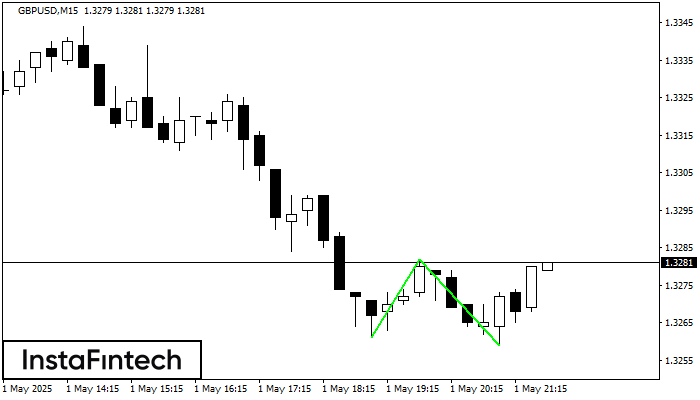
El patrón Doble Piso ha sido formado en GBPUSD M15; el límite superior es 1.3282; el límite inferior es 1.3259. El ancho del patrón es 21 puntos. En caso
Los marcos de tiempo M5 y M15 pueden tener más puntos de entrada falsos.
Open chart in a new window
Doble Techo
was formed on 01.05 at 20:30:19 (UTC+0)
signal strength 1 of 5
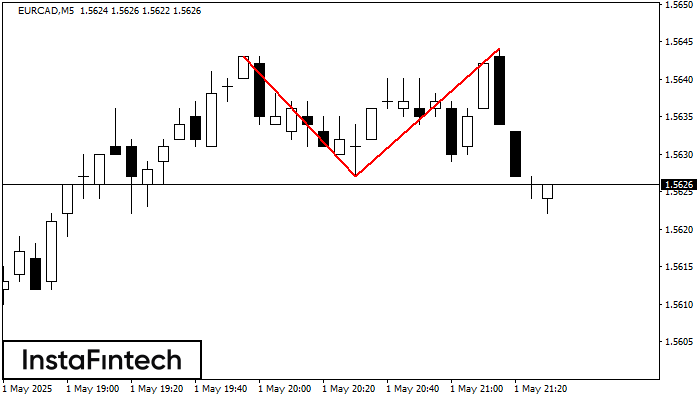
En el gráfico de EURCAD M5 el patrón de reversión Doble Techo ha sido formado. Características: límite superior 1.5644; límite inferior 1.5627; el ancho del patrón 17 puntos. La señal
Los marcos de tiempo M5 y M15 pueden tener más puntos de entrada falsos.
Open chart in a new window


