

Actual patterns

Patterns are graphical models which are formed in the chart by the price. According to one of the technical analysis postulates, history (price movement) repeats itself. It means that the price movements are often similar in the same situations which makes it possible to predict the further development of the situation with a high probability.
Relevant patterns by InstaTrade is an easy-to-use service which allows you to be aware of latest changes in the market and react to clues from the market in time. In our service you will always find the latest and most relevant patterns on any pair and any timeframe.
Bullish Symmetrical Triangle
was formed on 24.04 at 22:57:26 (UTC+0)
signal strength 1 of 5
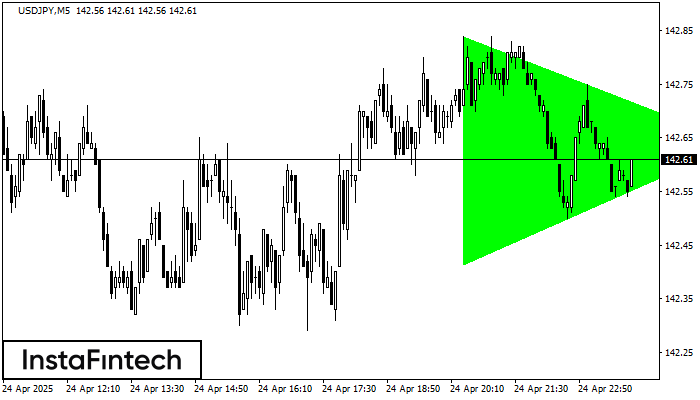
According to the chart of M5, USDJPY formed the Bullish Symmetrical Triangle pattern. The lower border of the pattern touches the coordinates 142.41/142.64 whereas the upper border goes across 142.84/142.64. If the Bullish Symmetrical Triangle pattern is in progress, this evidently signals a further upward trend. In other words, in case the scenario comes true, the price of USDJPY will breach the upper border to head for 142.79.
The M5 and M15 time frames may have more false entry points.
- All
- All
- Bearish Rectangle
- Bearish Symmetrical Triangle
- Bearish Symmetrical Triangle
- Bullish Rectangle
- Double Top
- Double Top
- Triple Bottom
- Triple Bottom
- Triple Top
- Triple Top
- All
- All
- Buy
- Sale
- All
- 1
- 2
- 3
- 4
- 5
Bearish Rectangle
was formed on 01.05 at 22:26:57 (UTC+0)
signal strength 2 of 5
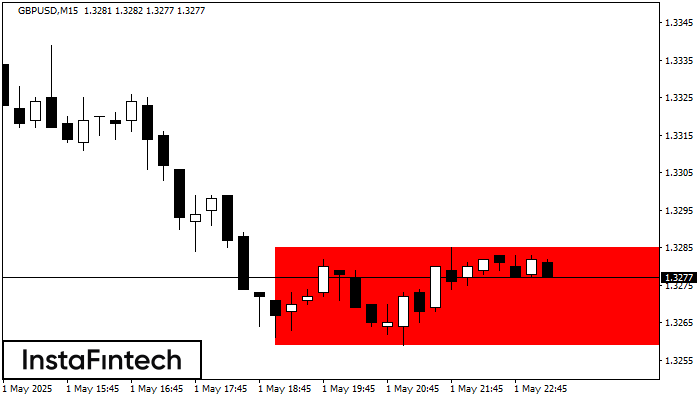
According to the chart of M15, GBPUSD formed the Bearish Rectangle. The pattern indicates a trend continuation. The upper border is 1.3285, the lower border is 1.3259. The signal means
The M5 and M15 time frames may have more false entry points.
Open chart in a new window
Bullish Flag
was formed on 01.05 at 22:00:22 (UTC+0)
signal strength 4 of 5
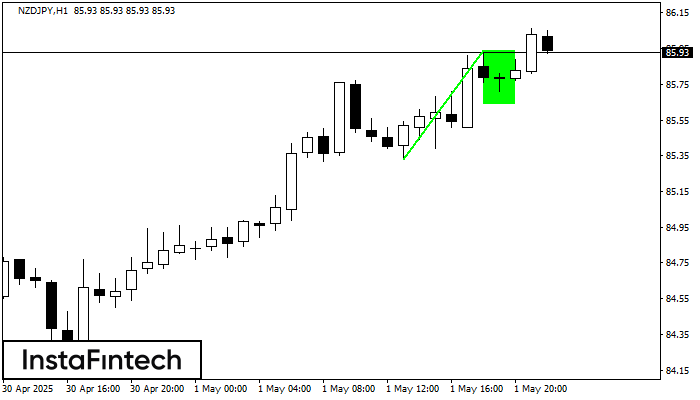
The Bullish Flag pattern which signals continuation of a trend has been formed on the chart NZDJPY H1. Forecast: if the price breaks above the pattern high at 85.94, then
Open chart in a new window
Bearish Rectangle
was formed on 01.05 at 21:45:52 (UTC+0)
signal strength 1 of 5
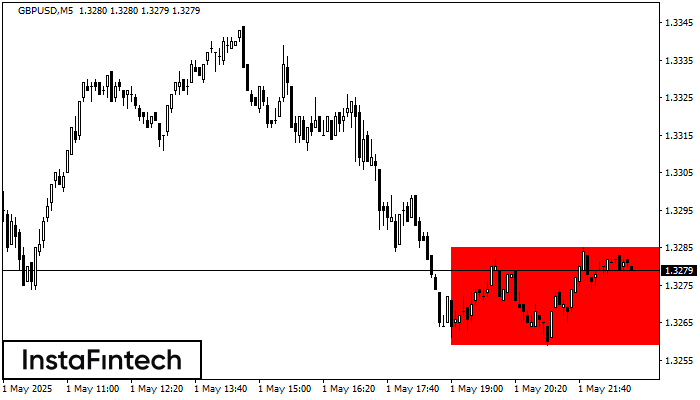
According to the chart of M5, GBPUSD formed the Bearish Rectangle. This type of a pattern indicates a trend continuation. It consists of two levels: resistance 1.3285 - 0.0000
The M5 and M15 time frames may have more false entry points.
Open chart in a new window


