

Actual patterns

Patterns are graphical models which are formed in the chart by the price. According to one of the technical analysis postulates, history (price movement) repeats itself. It means that the price movements are often similar in the same situations which makes it possible to predict the further development of the situation with a high probability.
Relevant patterns by InstaTrade is an easy-to-use service which allows you to be aware of latest changes in the market and react to clues from the market in time. In our service you will always find the latest and most relevant patterns on any pair and any timeframe.
Bullish Rectangle
was formed on 24.04 at 21:22:37 (UTC+0)
signal strength 1 of 5
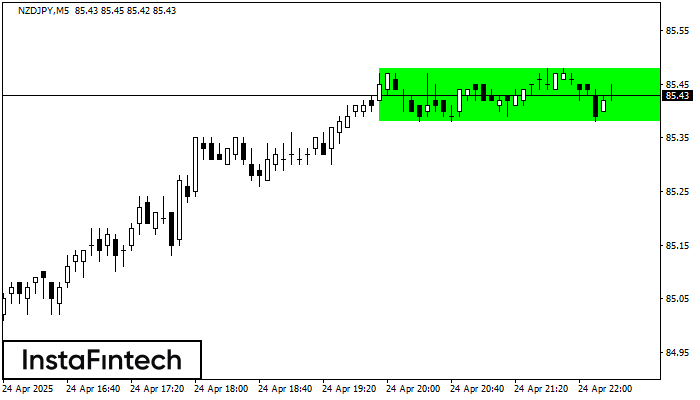
According to the chart of M5, NZDJPY formed the Bullish Rectangle. The pattern indicates a trend continuation. The upper border is 85.48, the lower border is 85.38. The signal means that a long position should be opened above the upper border 85.48 of the Bullish Rectangle.
The M5 and M15 time frames may have more false entry points.
See Also
- All
- All
- Bearish Rectangle
- Bearish Symmetrical Triangle
- Bearish Symmetrical Triangle
- Bullish Rectangle
- Double Top
- Double Top
- Triple Bottom
- Triple Bottom
- Triple Top
- Triple Top
- All
- All
- Buy
- Sale
- All
- 1
- 2
- 3
- 4
- 5
Doble Techo
was formed on 02.05 at 02:05:35 (UTC+0)
signal strength 1 of 5
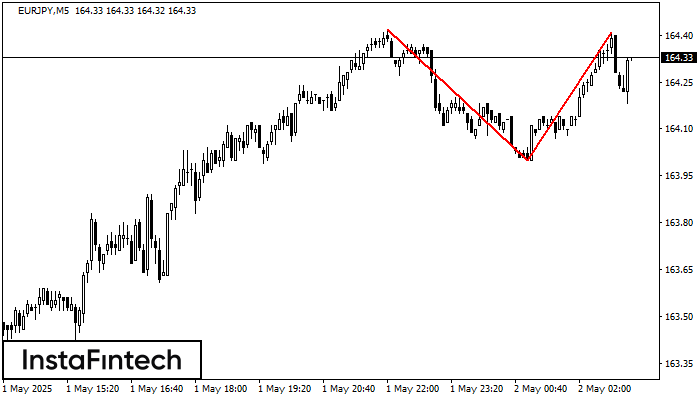
El patrón Doble Techo ha sido formado en EURJPY M5. Esto señala que la tendencia ha sido cambiada de alcista a bajista. Probablemente, si la base del patrón 164.00
Los marcos de tiempo M5 y M15 pueden tener más puntos de entrada falsos.
Open chart in a new window
Cabeza y Hombros Inverso
was formed on 02.05 at 02:00:07 (UTC+0)
signal strength 3 of 5
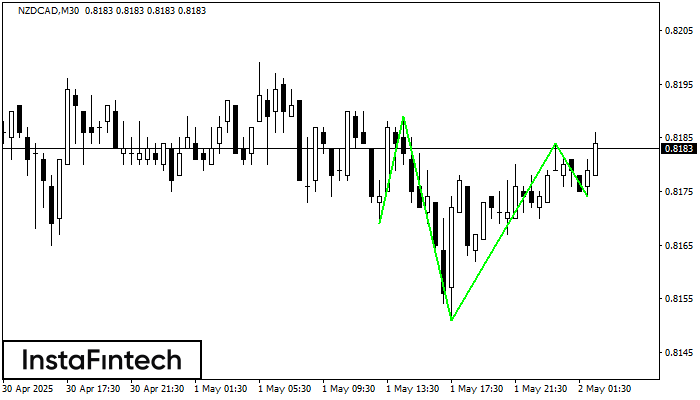
Según el gráfico de M30, NZDCAD formó el patrón Cabeza y Hombros Inverso. El techo de la Cabeza está establecido en 0.8184 mientras la línea media del Cuello se encuentra
Open chart in a new window
Doble Piso
was formed on 02.05 at 01:45:41 (UTC+0)
signal strength 2 of 5
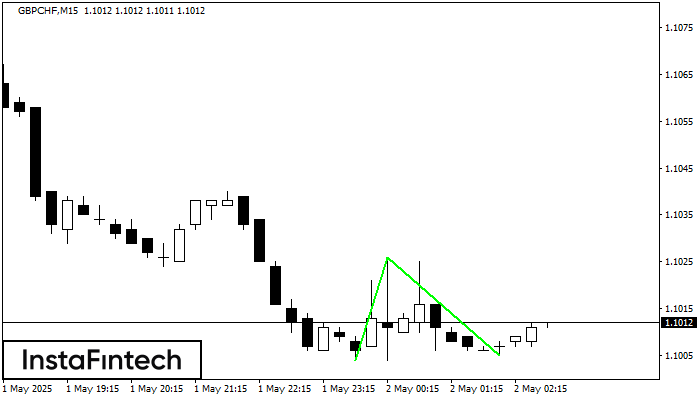
El patrón Doble Piso ha sido formado en GBPCHF M15. Esta formación señala una reversión de la tendencia de bajista a alcista. La señal es que se debe abrir
Los marcos de tiempo M5 y M15 pueden tener más puntos de entrada falsos.
Open chart in a new window


