

Actual patterns

Patterns are graphical models which are formed in the chart by the price. According to one of the technical analysis postulates, history (price movement) repeats itself. It means that the price movements are often similar in the same situations which makes it possible to predict the further development of the situation with a high probability.
Relevant patterns by InstaTrade is an easy-to-use service which allows you to be aware of latest changes in the market and react to clues from the market in time. In our service you will always find the latest and most relevant patterns on any pair and any timeframe.
Bullish Symmetrical Triangle
was formed on 21.04 at 15:33:18 (UTC+0)
signal strength 2 of 5

According to the chart of M15, #Bitcoin formed the Bullish Symmetrical Triangle pattern. Description: This is the pattern of a trend continuation. 87754.54 and 86429.29 are the coordinates of the upper and lower borders respectively. The pattern width is measured on the chart at 132525 pips. Outlook: If the upper border 87754.54 is broken, the price is likely to continue its move by 87116.24.
The M5 and M15 time frames may have more false entry points.
- All
- All
- Bearish Rectangle
- Bearish Symmetrical Triangle
- Bearish Symmetrical Triangle
- Bullish Rectangle
- Double Top
- Double Top
- Triple Bottom
- Triple Bottom
- Triple Top
- Triple Top
- All
- All
- Buy
- Sale
- All
- 1
- 2
- 3
- 4
- 5
Rectángulo Bajista
was formed on 01.05 at 21:45:52 (UTC+0)
signal strength 1 of 5
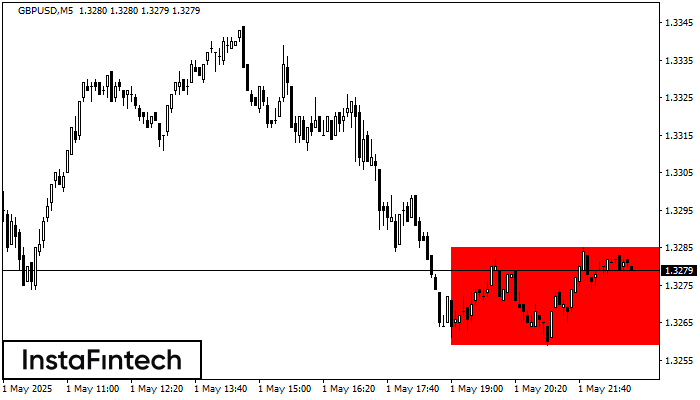
Según el gráfico de M5, GBPUSD formó el Rectángulo Bajista. Este tipo de patrón indica la continuación de una tendencia. Esto consiste de dos niveles: resistencia 1.3285 - 0.0000
Los marcos de tiempo M5 y M15 pueden tener más puntos de entrada falsos.
Open chart in a new window
Doble Piso
was formed on 01.05 at 21:40:21 (UTC+0)
signal strength 1 of 5
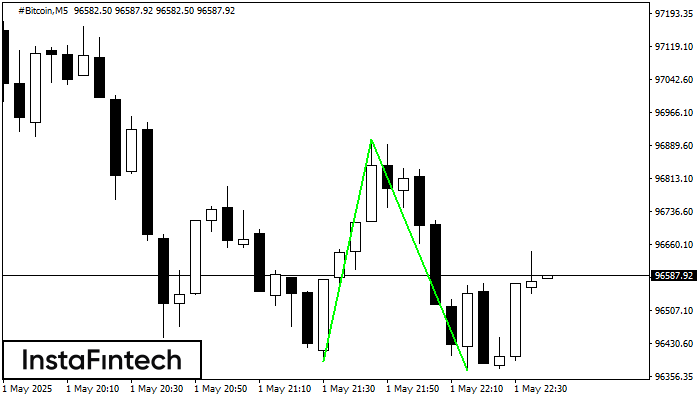
El patrón Doble Piso ha sido formado en #Bitcoin M5. Esta formación señala una reversión de la tendencia de bajista a alcista. La señal es que se debe abrir
Los marcos de tiempo M5 y M15 pueden tener más puntos de entrada falsos.
Open chart in a new window
Triple Piso
was formed on 01.05 at 21:30:25 (UTC+0)
signal strength 1 of 5
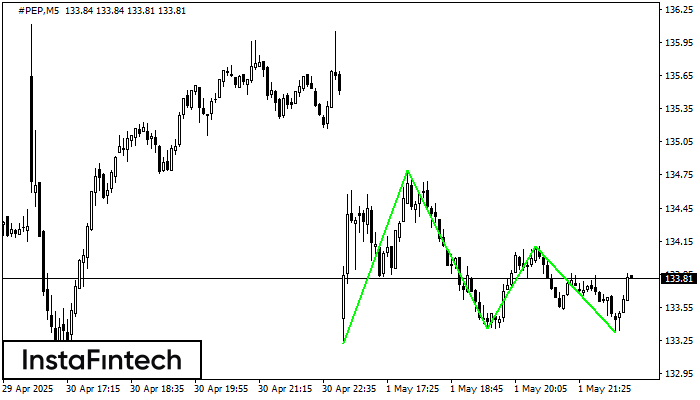
El patrón Triple Piso ha sido formado en #PEP M5. Este tiene las siguientes características: nivel de resistencia 134.79/134.10; nivel de soporte 133.22/133.32; el ancho es 157 puntos. En caso
Los marcos de tiempo M5 y M15 pueden tener más puntos de entrada falsos.
Open chart in a new window


