

Actual patterns

Patterns are graphical models which are formed in the chart by the price. According to one of the technical analysis postulates, history (price movement) repeats itself. It means that the price movements are often similar in the same situations which makes it possible to predict the further development of the situation with a high probability.
Relevant patterns by InstaTrade is an easy-to-use service which allows you to be aware of latest changes in the market and react to clues from the market in time. In our service you will always find the latest and most relevant patterns on any pair and any timeframe.
Triple Bottom
was formed on 02.04 at 13:45:17 (UTC+0)
signal strength 2 of 5
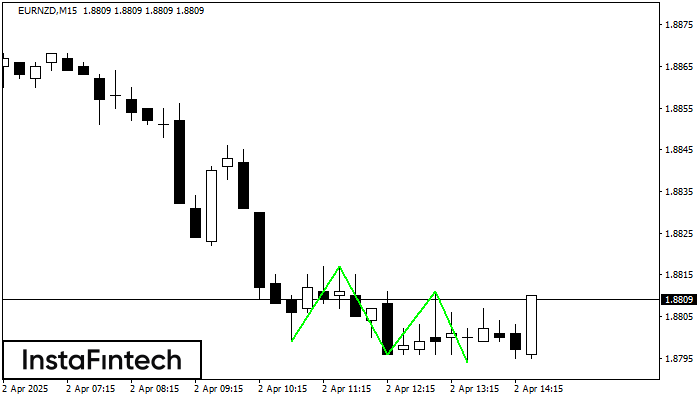
The Triple Bottom pattern has formed on the chart of EURNZD M15. Features of the pattern: The lower line of the pattern has coordinates 1.8817 with the upper limit 1.8817/1.8811, the projection of the width is 18 points. The formation of the Triple Bottom pattern most likely indicates a change in the trend from downward to upward. This means that in the event of a breakdown of the resistance level 1.8799, the price is most likely to continue the upward movement.
The M5 and M15 time frames may have more false entry points.
- All
- All
- Bearish Rectangle
- Bearish Symmetrical Triangle
- Bearish Symmetrical Triangle
- Bullish Rectangle
- Double Top
- Double Top
- Triple Bottom
- Triple Bottom
- Triple Top
- Triple Top
- All
- All
- Buy
- Sale
- All
- 1
- 2
- 3
- 4
- 5
Double Top
was formed on 18.04 at 04:10:38 (UTC+0)
signal strength 1 of 5
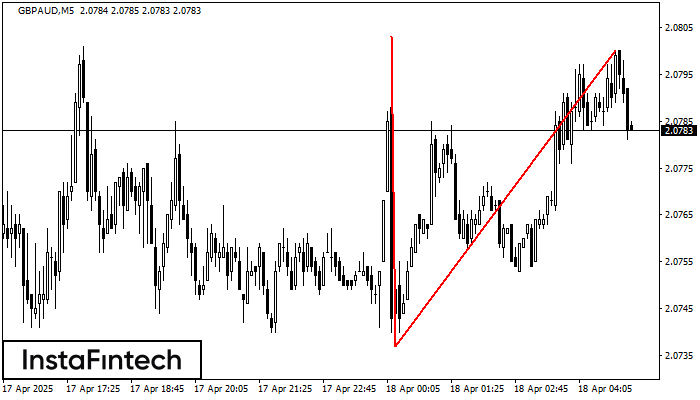
Corak pembalikan Double Top telah dibentuk pada GBPAUD M5. Ciri-ciri: sempadan atas %P0.000000; sempadan bawah 2.0803; sempadan bawah 2.0737; lebar corak adalah 63 mata. Dagangan menjual adalah lebih baik untuk
Carta masa M5 dan M15 mungkin mempunyai lebih banyak titik kemasukan palsu.
Open chart in a new window
Double Top
was formed on 18.04 at 04:00:48 (UTC+0)
signal strength 3 of 5
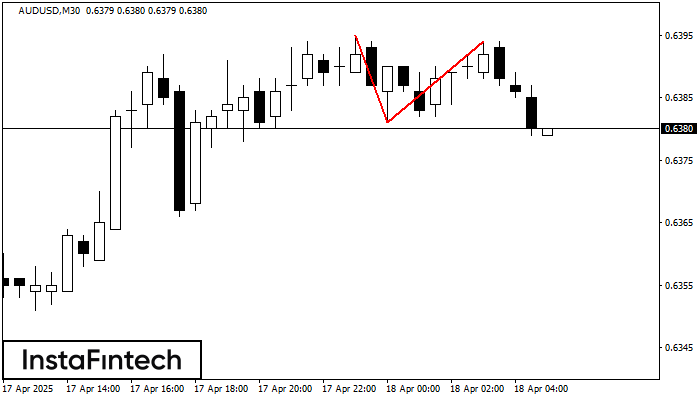
Pada carta AUDUSD M30 corak pembalikan Double Top telah terbentuk. Ciri-ciri: sempadan atas 0.6394; sempadan bawah 0.6381; lebar corak 13 mata. Isyarat: penembusan sempadan bawah akan menyebabkan kesinambungan arah aliran
Open chart in a new window
Double Bottom
was formed on 18.04 at 03:05:35 (UTC+0)
signal strength 1 of 5
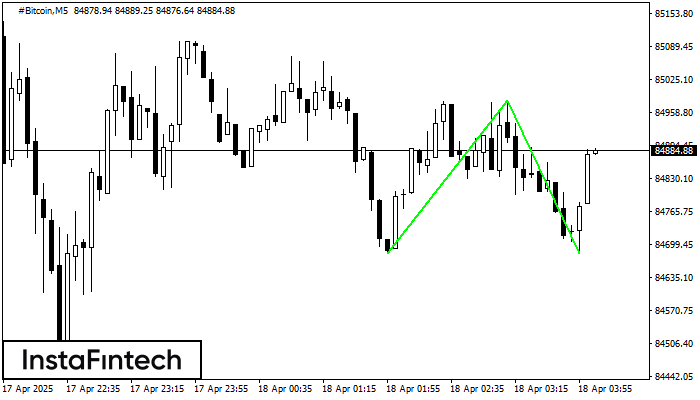
Corak Double Bottom telah dibentuk pada #Bitcoin M5. Ciri-ciri: tahap sokongan 84682.60; tahap rintangan 84984.00; lebar corak 30140 mata. Sekiranya tahap rintangan ditembusi, perubahan aliran boleh diramalkan dengan titik sasaran
Carta masa M5 dan M15 mungkin mempunyai lebih banyak titik kemasukan palsu.
Open chart in a new window


