

Долзарб паттернлар

Двойная вершина
сформирован 15.04 в 23:00:28 (UTC+0)
сила сигнала 2 из 5
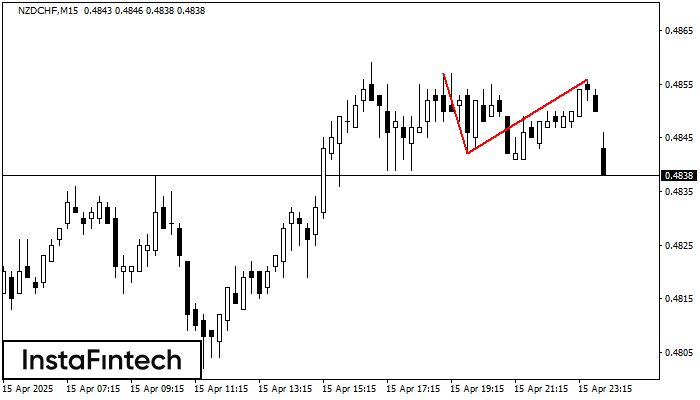
По торговому инструменту NZDCHF на M15 сформировалась фигура «Двойная вершина», которая сигнализирует нам об изменении тенденции с восходящей на нисходящую. Вероятно, что, в случае пробоя основания фигуры 0.4842, возможно дальнейшее нисходящее движение.
Таймфреймы М5 и М15 могут иметь больше ложных точек входа.
Шунингдек кўринг
- Все
- Все
- Bearish Rectangle
- Bearish Symmetrical Triangle
- Bearish Symmetrical Triangle
- Bullish Rectangle
- Double Top
- Double Top
- Triple Bottom
- Triple Bottom
- Triple Top
- Triple Top
- Все
- Все
- Покупка
- Продажа
- Все
- 1
- 2
- 3
- 4
- 5
Double Bottom
was formed on 06.05 at 03:45:33 (UTC+0)
signal strength 1 of 5
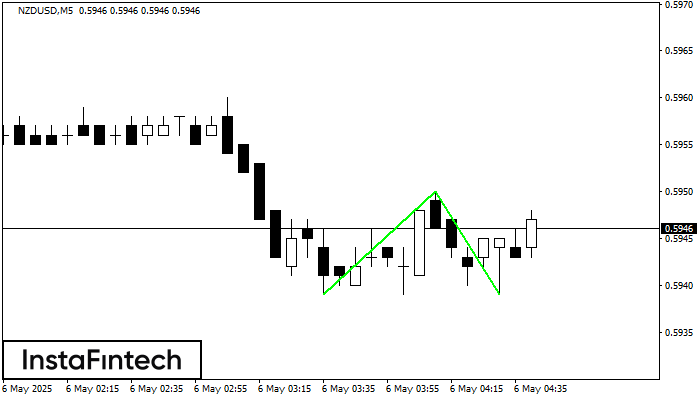
The Double Bottom pattern has been formed on NZDUSD M5; the upper boundary is 0.5950; the lower boundary is 0.5939. The width of the pattern is 11 points. In case
The M5 and M15 time frames may have more false entry points.
Open chart in a new window
Triple Bottom
was formed on 06.05 at 03:00:35 (UTC+0)
signal strength 4 of 5

The Triple Bottom pattern has been formed on GBPCHF H1. It has the following characteristics: resistance level 1.0997/1.0988; support level 1.0919/1.0919; the width is 78 points. In the event
Open chart in a new window
Triple Bottom
was formed on 06.05 at 03:00:33 (UTC+0)
signal strength 4 of 5
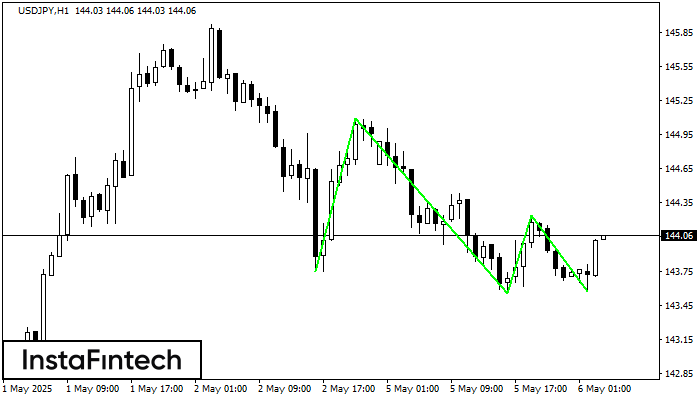
The Triple Bottom pattern has formed on the chart of USDJPY H1. Features of the pattern: The lower line of the pattern has coordinates 145.09 with the upper limit 145.09/144.24
Open chart in a new window


