

Долзарб паттернлар

Прямоугольник
сформирован 14.04 в 19:23:06 (UTC+0)
сила сигнала 3 из 5
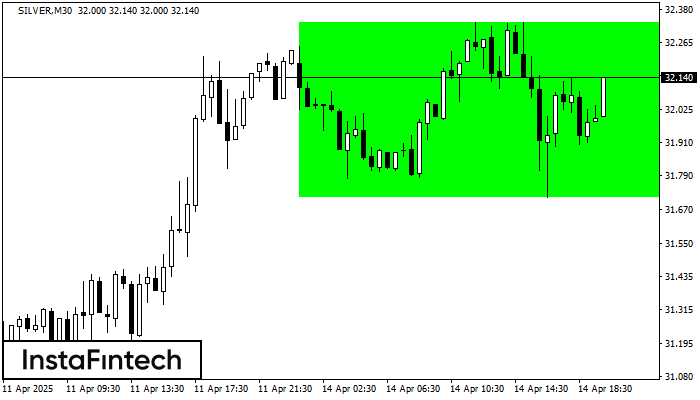
Сформирована фигура «Прямоугольник» на графике SILVER M30. Тип фигуры: Продолжение тренда; Границы: Верхняя 32.34, Нижняя 31.71; Сигнал: позицию на покупку следует открывать выше верхней границы прямоугольника 32.34.
- Все
- Все
- Bearish Rectangle
- Bearish Symmetrical Triangle
- Bearish Symmetrical Triangle
- Bullish Rectangle
- Double Top
- Double Top
- Triple Bottom
- Triple Bottom
- Triple Top
- Triple Top
- Все
- Все
- Покупка
- Продажа
- Все
- 1
- 2
- 3
- 4
- 5
Double Top
was formed on 12.05 at 12:45:33 (UTC+0)
signal strength 1 of 5
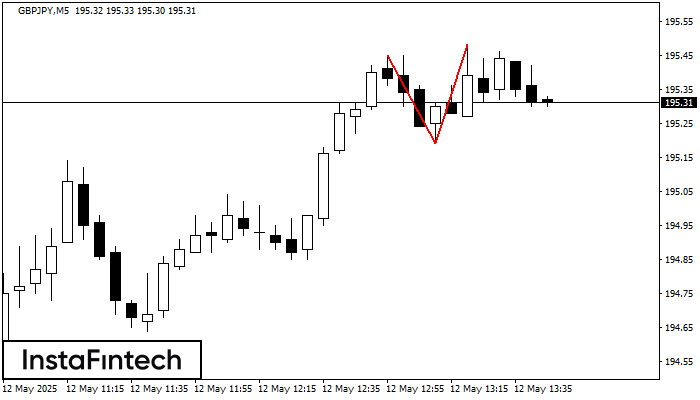
On the chart of GBPJPY M5 the Double Top reversal pattern has been formed. Characteristics: the upper boundary 195.48; the lower boundary 195.19; the width of the pattern 29 points
The M5 and M15 time frames may have more false entry points.
Open chart in a new window
Double Top
was formed on 12.05 at 12:10:20 (UTC+0)
signal strength 1 of 5
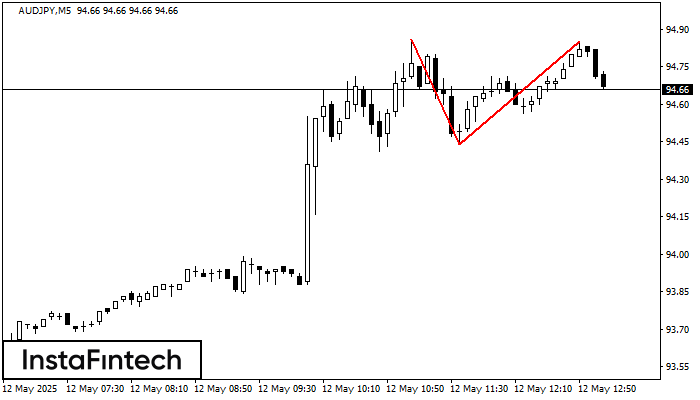
On the chart of AUDJPY M5 the Double Top reversal pattern has been formed. Characteristics: the upper boundary 94.85; the lower boundary 94.44; the width of the pattern 41 points
The M5 and M15 time frames may have more false entry points.
Open chart in a new window
Bearish Rectangle
was formed on 12.05 at 11:15:24 (UTC+0)
signal strength 1 of 5
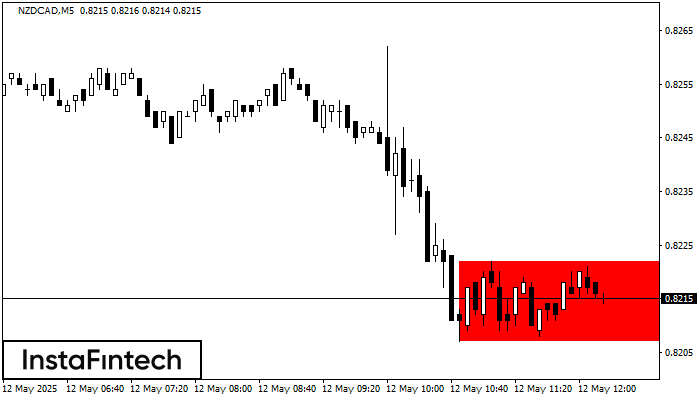
According to the chart of M5, NZDCAD formed the Bearish Rectangle. This type of a pattern indicates a trend continuation. It consists of two levels: resistance 0.8222 - 0.0000
The M5 and M15 time frames may have more false entry points.
Open chart in a new window


