

Долзарб паттернлар

Двойная вершина
сформирован 14.04 в 11:30:12 (UTC+0)
сила сигнала 2 из 5
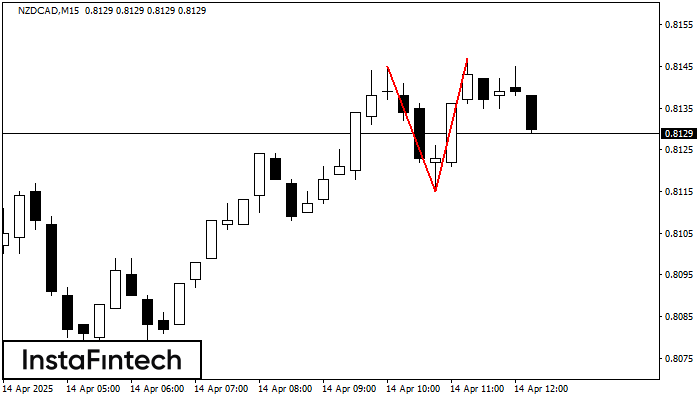
По торговому инструменту NZDCAD на M15 сформировалась фигура «Двойная вершина», которая сигнализирует нам об изменении тенденции с восходящей на нисходящую. Вероятно, что, в случае пробоя основания фигуры 0.8115, возможно дальнейшее нисходящее движение.
Таймфреймы М5 и М15 могут иметь больше ложных точек входа.
- Все
- Все
- Bearish Rectangle
- Bearish Symmetrical Triangle
- Bearish Symmetrical Triangle
- Bullish Rectangle
- Double Top
- Double Top
- Triple Bottom
- Triple Bottom
- Triple Top
- Triple Top
- Все
- Все
- Покупка
- Продажа
- Все
- 1
- 2
- 3
- 4
- 5
Bearish Symmetrical Triangle
was formed on 06.05 at 01:57:23 (UTC+0)
signal strength 1 of 5
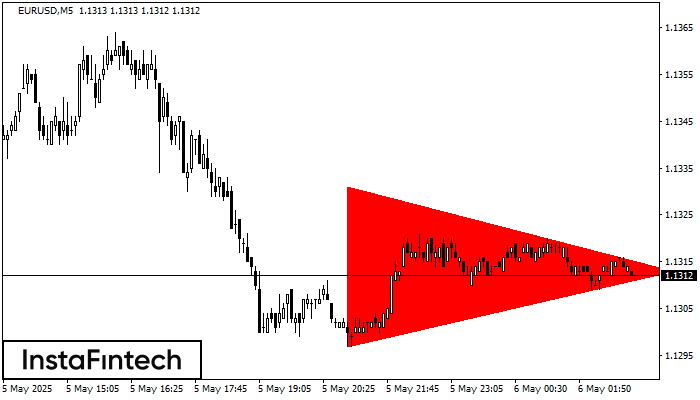
According to the chart of M5, EURUSD formed the Bearish Symmetrical Triangle pattern. Trading recommendations: A breach of the lower border 1.1297 is likely to encourage a continuation
The M5 and M15 time frames may have more false entry points.
Open chart in a new window
Bullish Symmetrical Triangle
was formed on 06.05 at 01:46:31 (UTC+0)
signal strength 2 of 5
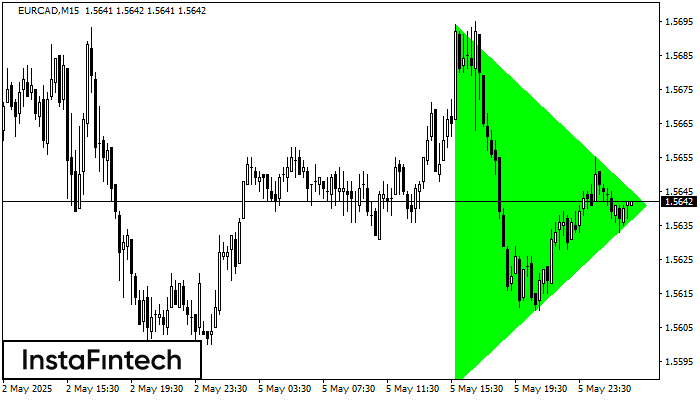
According to the chart of M15, EURCAD formed the Bullish Symmetrical Triangle pattern. The lower border of the pattern touches the coordinates 1.5588/1.5641 whereas the upper border goes across 1.5694/1.5641
The M5 and M15 time frames may have more false entry points.
Open chart in a new window
Bullish Symmetrical Triangle
was formed on 06.05 at 01:24:48 (UTC+0)
signal strength 1 of 5
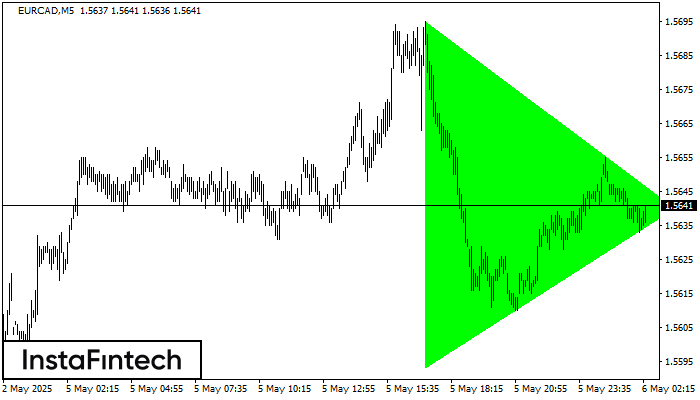
According to the chart of M5, EURCAD formed the Bullish Symmetrical Triangle pattern. The lower border of the pattern touches the coordinates 1.5593/1.5640 whereas the upper border goes across 1.5695/1.5640
The M5 and M15 time frames may have more false entry points.
Open chart in a new window


