

Долзарб паттернлар

Прямоугольник
сформирован 04.04 в 00:05:11 (UTC+0)
сила сигнала 1 из 5
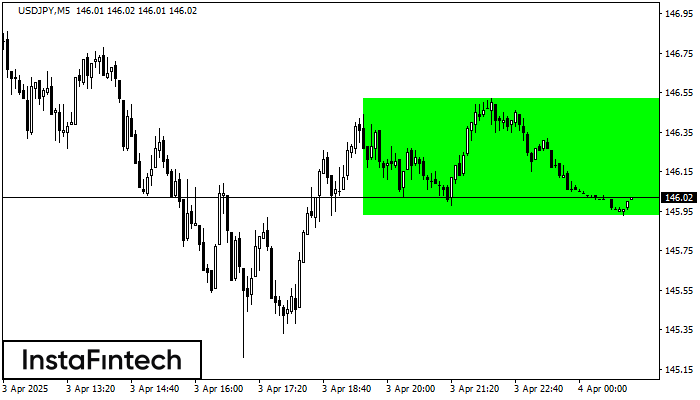
По USDJPY на M5 сформировалась фигура «Прямоугольник». Фигура данного типа относится к тому типу продолжения тренда, который содержит в себе два уровня: Сопротивление 146.52; Поддержка 145.93. В случае пробоя уровня сопротивления 146.52 возможно дальнейшее восходящее движение.
Таймфреймы М5 и М15 могут иметь больше ложных точек входа.
- Все
- Все
- Bearish Rectangle
- Bearish Symmetrical Triangle
- Bearish Symmetrical Triangle
- Bullish Rectangle
- Double Top
- Double Top
- Triple Bottom
- Triple Bottom
- Triple Top
- Triple Top
- Все
- Все
- Покупка
- Продажа
- Все
- 1
- 2
- 3
- 4
- 5
Bullish Symmetrical Triangle
was formed on 08.05 at 14:55:45 (UTC+0)
signal strength 1 of 5
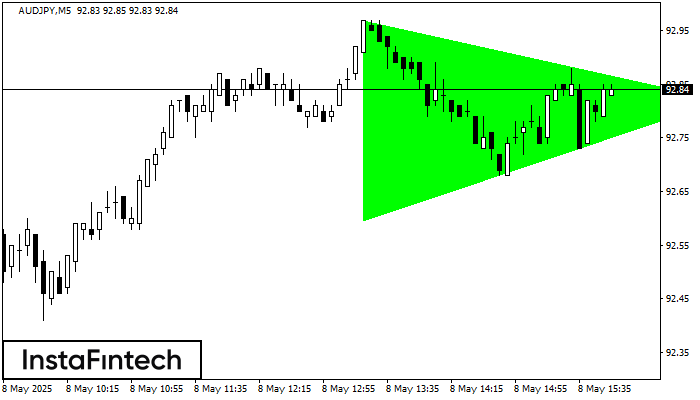
According to the chart of M5, AUDJPY formed the Bullish Symmetrical Triangle pattern. Description: This is the pattern of a trend continuation. 92.97 and 92.60 are the coordinates
The M5 and M15 time frames may have more false entry points.
Open chart in a new window
Bearish Symmetrical Triangle
was formed on 08.05 at 14:35:35 (UTC+0)
signal strength 1 of 5
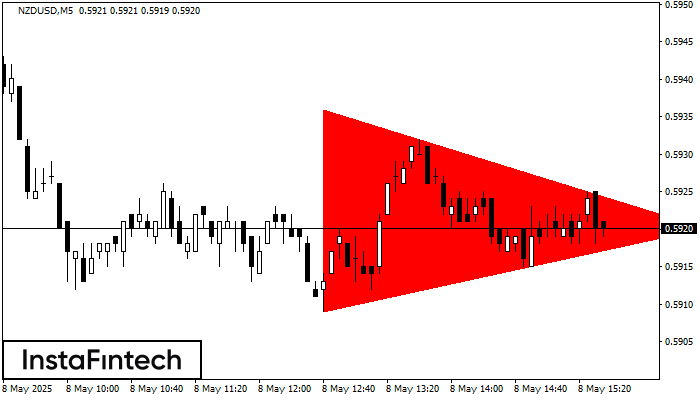
According to the chart of M5, NZDUSD formed the Bearish Symmetrical Triangle pattern. This pattern signals a further downward trend in case the lower border 0.5909 is breached. Here
The M5 and M15 time frames may have more false entry points.
Open chart in a new window
Double Bottom
was formed on 08.05 at 14:10:47 (UTC+0)
signal strength 1 of 5
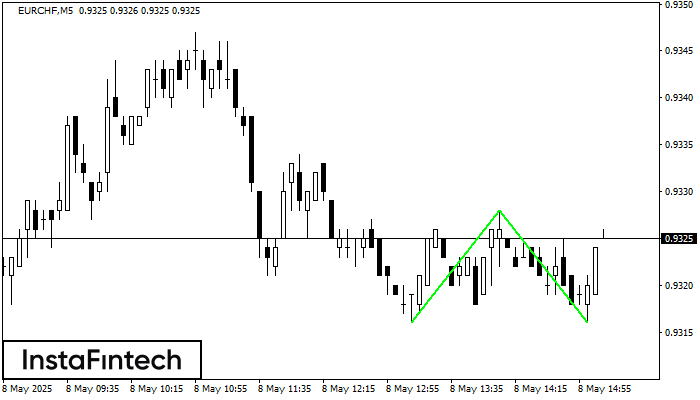
The Double Bottom pattern has been formed on EURCHF M5. Characteristics: the support level 0.9316; the resistance level 0.9328; the width of the pattern 12 points. If the resistance level
The M5 and M15 time frames may have more false entry points.
Open chart in a new window


