

Долзарб паттернлар

Двойное дно
сформирован 03.04 в 18:50:19 (UTC+0)
сила сигнала 1 из 5
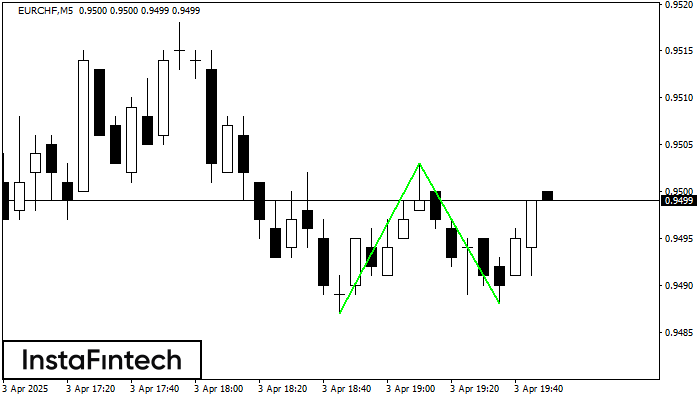
Сформирована фигура «Двойное дно» на графике EURCHF M5. Верхняя граница 0.9503; Нижняя граница 0.9488; Ширина фигуры 16 пунктов. В случае пробоя верхней границы 0.9503 можно будет прогнозировать изменение тенденции, где ширина фигуры и будет являться расстоянием предположительного Тейк Профита.
Таймфреймы М5 и М15 могут иметь больше ложных точек входа.
Шунингдек кўринг
- Все
- Все
- Bearish Rectangle
- Bearish Symmetrical Triangle
- Bearish Symmetrical Triangle
- Bullish Rectangle
- Double Top
- Double Top
- Triple Bottom
- Triple Bottom
- Triple Top
- Triple Top
- Все
- Все
- Покупка
- Продажа
- Все
- 1
- 2
- 3
- 4
- 5
Bullish Rectangle
was formed on 08.05 at 07:42:13 (UTC+0)
signal strength 1 of 5
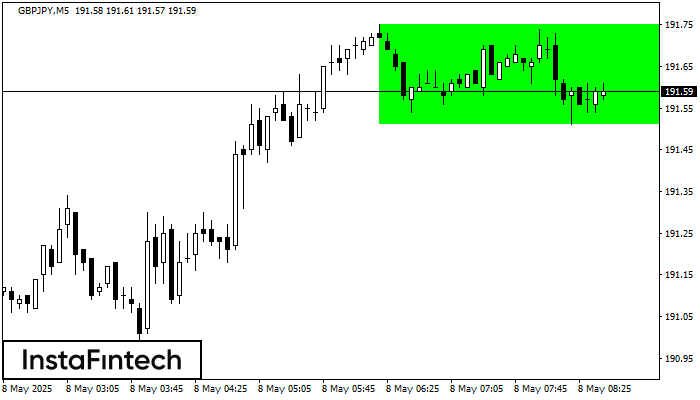
According to the chart of M5, GBPJPY formed the Bullish Rectangle. The pattern indicates a trend continuation. The upper border is 191.75, the lower border is 191.51. The signal means
The M5 and M15 time frames may have more false entry points.
Open chart in a new window
Triple Top
was formed on 08.05 at 07:30:25 (UTC+0)
signal strength 2 of 5
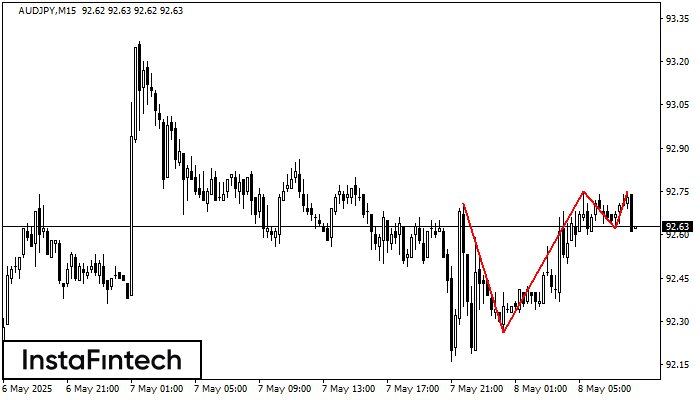
The Triple Top pattern has formed on the chart of the AUDJPY M15 trading instrument. It is a reversal pattern featuring the following characteristics: resistance level -4, support level -36
The M5 and M15 time frames may have more false entry points.
Open chart in a new window
Triple Top
was formed on 08.05 at 07:15:11 (UTC+0)
signal strength 1 of 5
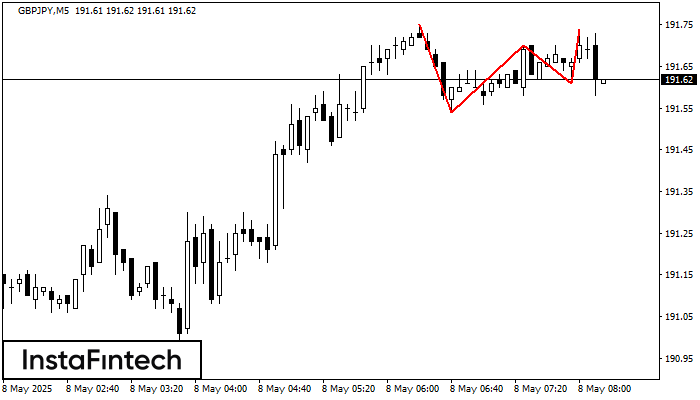
On the chart of the GBPJPY M5 trading instrument, the Triple Top pattern that signals a trend change has formed. It is possible that after formation of the third peak
The M5 and M15 time frames may have more false entry points.
Open chart in a new window


