

Долзарб паттернлар

Двойная вершина
сформирован 31.03 в 13:22:23 (UTC+0)
сила сигнала 1 из 5
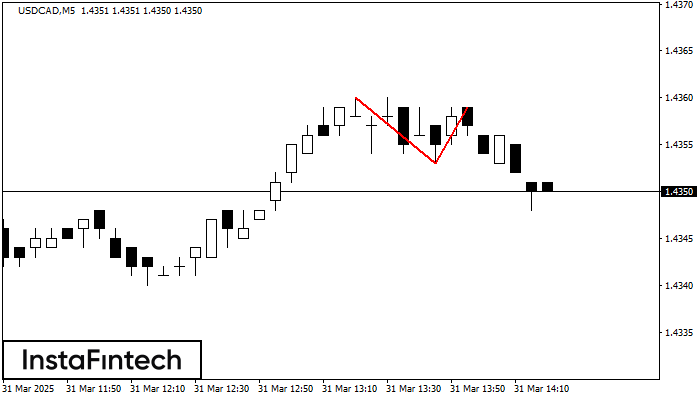
На торговом графике USDCAD M5 сформировалась разворотная фигура «Двойная вершина». Характеристика: Верхняя граница 1.4359; Нижняя граница 1.4353; Ширина фигуры 6 пунктов. Сигнал: Пробой нижней границы 1.4353 приведет к дальнейшему нисходящему движению с перспективой хода к уровню 1.4338.
Таймфреймы М5 и М15 могут иметь больше ложных точек входа.
- Все
- Все
- Bearish Rectangle
- Bearish Symmetrical Triangle
- Bearish Symmetrical Triangle
- Bullish Rectangle
- Double Top
- Double Top
- Triple Bottom
- Triple Bottom
- Triple Top
- Triple Top
- Все
- Все
- Покупка
- Продажа
- Все
- 1
- 2
- 3
- 4
- 5
Bullish Symmetrical Triangle
was formed on 07.05 at 11:25:56 (UTC+0)
signal strength 1 of 5
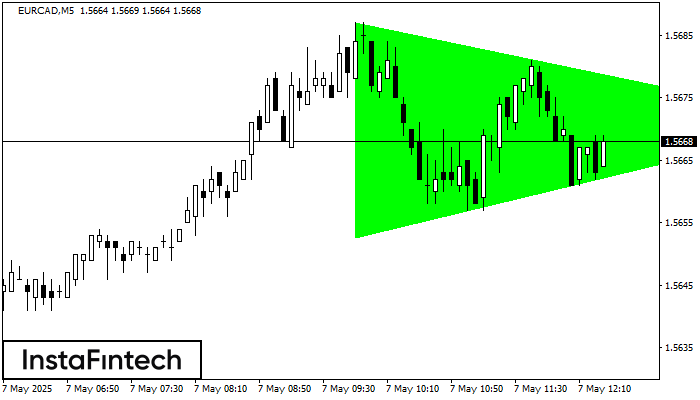
According to the chart of M5, EURCAD formed the Bullish Symmetrical Triangle pattern. The lower border of the pattern touches the coordinates 1.5653/1.5671 whereas the upper border goes across 1.5687/1.5671
The M5 and M15 time frames may have more false entry points.
Open chart in a new window
Double Top
was formed on 07.05 at 10:59:51 (UTC+0)
signal strength 2 of 5
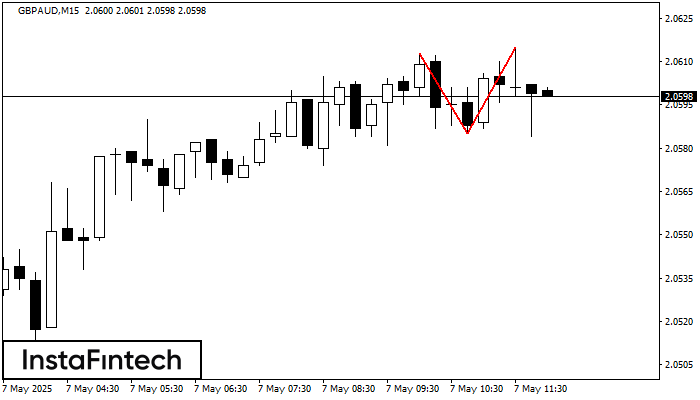
The Double Top reversal pattern has been formed on GBPAUD M15. Characteristics: the upper boundary 2.0613; the lower boundary 2.0585; the width of the pattern is 30 points. Sell trades
The M5 and M15 time frames may have more false entry points.
Open chart in a new window
Double Top
was formed on 07.05 at 10:54:49 (UTC+0)
signal strength 1 of 5
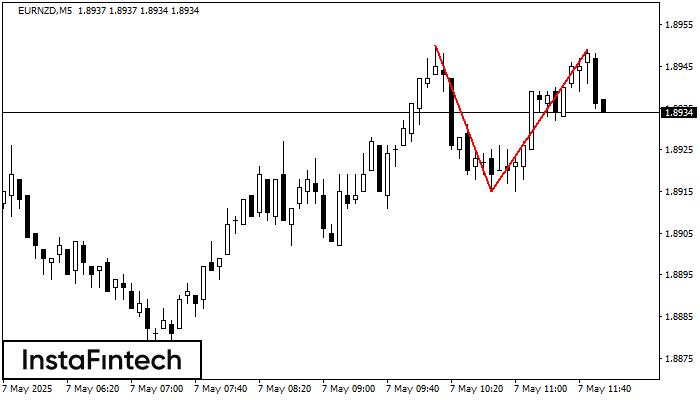
On the chart of EURNZD M5 the Double Top reversal pattern has been formed. Characteristics: the upper boundary 1.8949; the lower boundary 1.8915; the width of the pattern 34 points
The M5 and M15 time frames may have more false entry points.
Open chart in a new window


