

Долзарб паттернлар

Медвежий симметричный треугольник
сформирован 28.03 в 13:59:43 (UTC+0)
сила сигнала 4 из 5
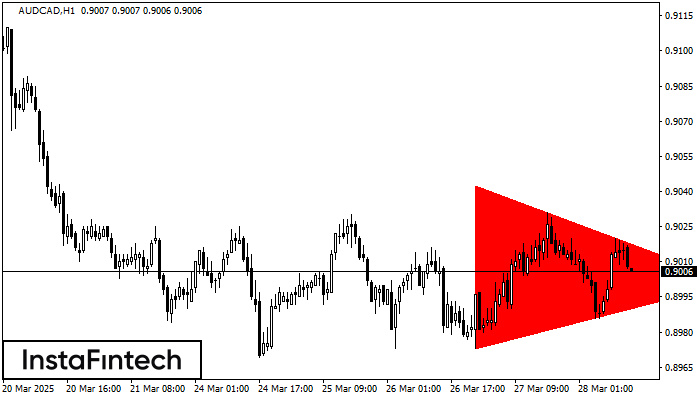
По AUDCAD H1 сформировалась фигура «Медвежий симметричный треугольник». Данная фигура сигнализирует нам о продолжении нисходящего тренда в случае пробоя нижней границы 0.8973, где вероятная прибыль будет являться шириной текущей фигуры -70 пунктов.
Шунингдек кўринг
- Все
- Все
- Bearish Rectangle
- Bearish Symmetrical Triangle
- Bearish Symmetrical Triangle
- Bullish Rectangle
- Double Top
- Double Top
- Triple Bottom
- Triple Bottom
- Triple Top
- Triple Top
- Все
- Все
- Покупка
- Продажа
- Все
- 1
- 2
- 3
- 4
- 5
Bearish Symmetrical Triangle
was formed on 22.04 at 08:47:25 (UTC+0)
signal strength 1 of 5

According to the chart of M5, EURNZD formed the Bearish Symmetrical Triangle pattern. This pattern signals a further downward trend in case the lower border 1.9139 is breached. Here
The M5 and M15 time frames may have more false entry points.
Open chart in a new window
Bullish Symmetrical Triangle
was formed on 22.04 at 08:31:06 (UTC+0)
signal strength 1 of 5
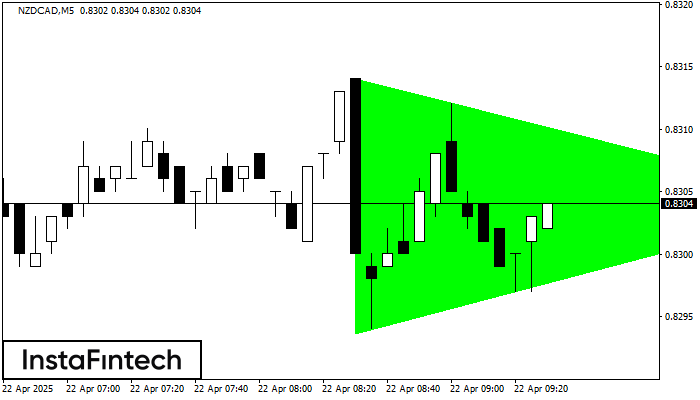
According to the chart of M5, NZDCAD formed the Bullish Symmetrical Triangle pattern, which signals the trend will continue. Description. The upper border of the pattern touches the coordinates 0.8314/0.8304
The M5 and M15 time frames may have more false entry points.
Open chart in a new window
Double Bottom
was formed on 22.04 at 07:00:30 (UTC+0)
signal strength 1 of 5
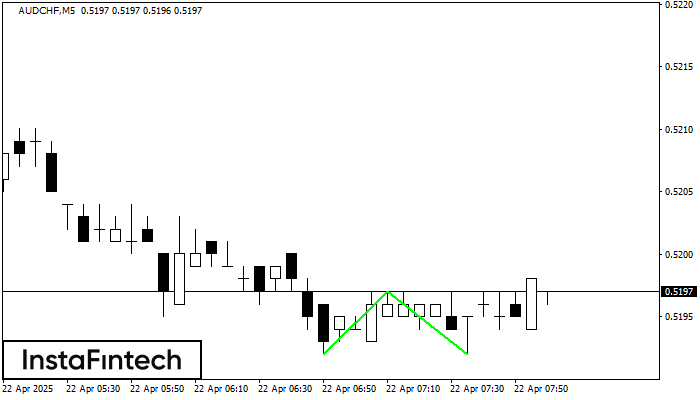
The Double Bottom pattern has been formed on AUDCHF M5; the upper boundary is 0.5197; the lower boundary is 0.5192. The width of the pattern is 5 points. In case
The M5 and M15 time frames may have more false entry points.
Open chart in a new window


